The read · The electorate
The no-party voter is the margin. Nobody is talking to them.
386,382 Kentuckians are registered in neither party — one in nine voters, and growing in 113 of 120 counties. None of them could vote in May. All of them can vote in November. They turn out fifteen to twenty points below everyone else, they live in Northern Kentucky, the Army counties and the suburbs, and no campaign in this state has a plan for them.
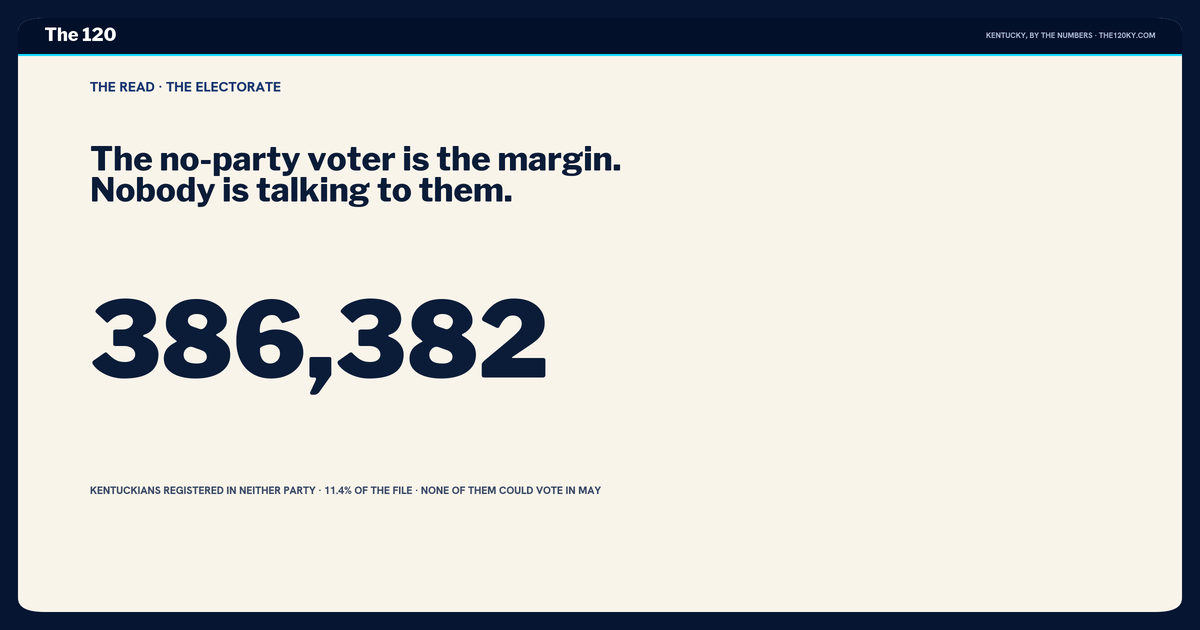
LOUISVILLE — Kentucky runs closed primaries. If you're registered as a Democrat you vote in the Democratic primary; a Republican, the Republican one; anyone else stays home in May. That rule has an electorate attached to it, and the electorate is bigger than most people running for office think. As of the August file, 386,382 Kentuckians are registered in neither major party — no-party, independent, Libertarian, the handful of others the Secretary of State rolls into one column. That's 11.4% of everyone on the rolls. It was 6.7% in 2010. It grew in 113 of 120 counties between May and August, and in Jefferson County it grew faster than either party.
I wrote about them last week as the column that took 6,723 of the 16,353 new registrations since the primary. This is the rest of the story: where they are, whether they vote, and why the answer to the second question is the most expensive thing about the first.
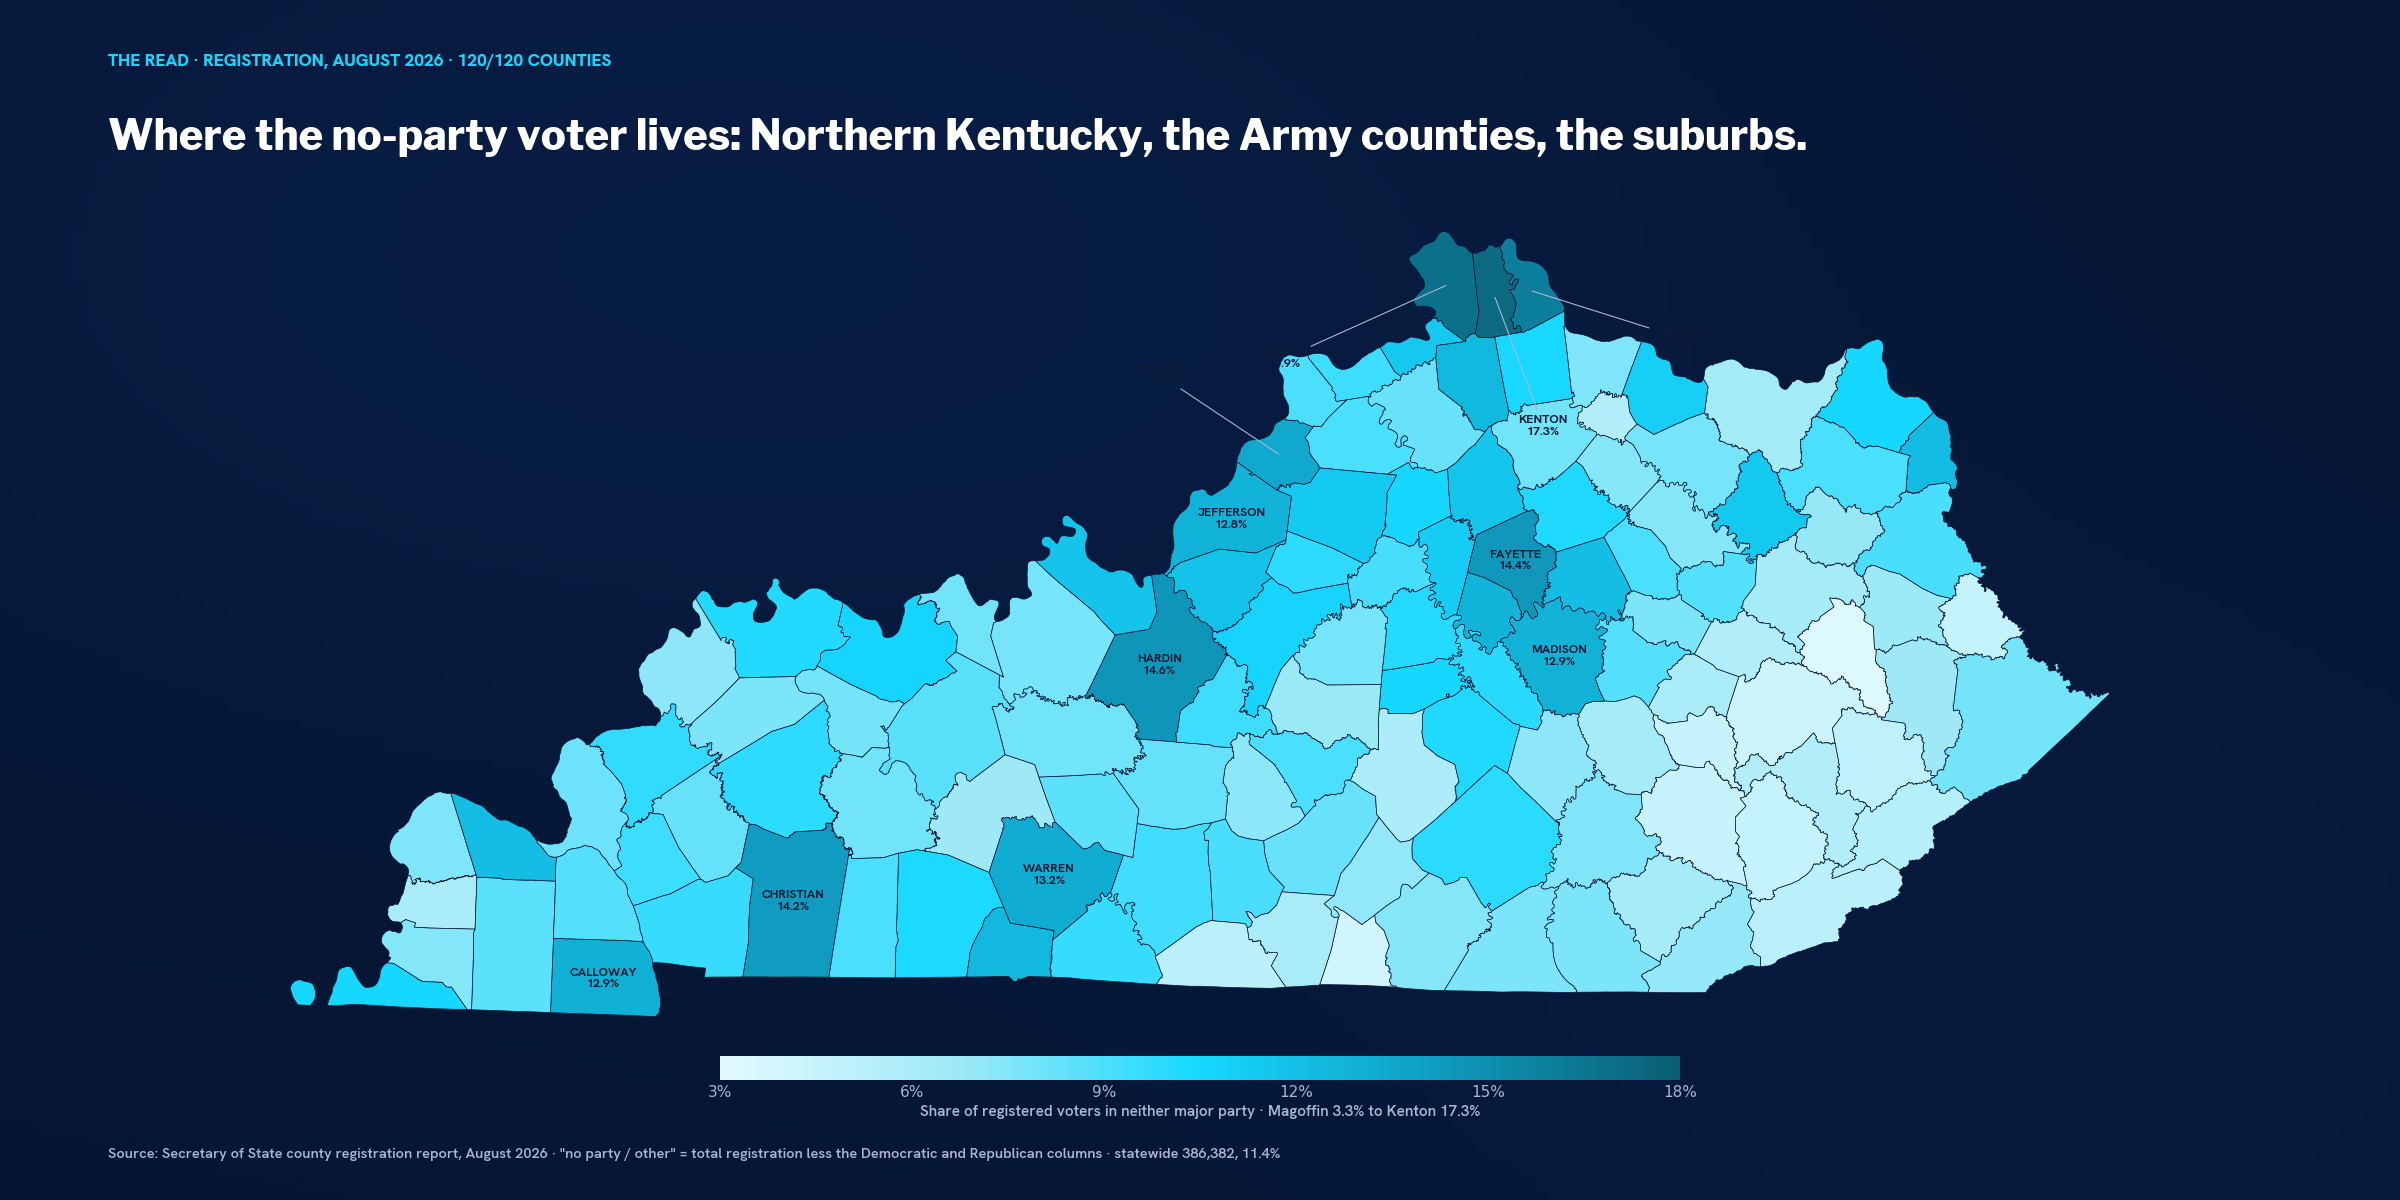
Where they are. Northern Kentucky is the no-party capital of the state: Kenton 17.3%, Boone 16.9%, Campbell 16.0% — the three counties with the highest share, and together 55,450 voters. Then the two Army counties, Hardin at 14.6% and Christian at 14.2%, which is Fort Knox and Fort Campbell showing up in the file as people who registered on a base and never picked a side. Then Fayette, 14.4%, 32,637 voters. Then the collar: Oldham 13.5%, Warren 13.2%, Madison 12.9%, Jessamine 12.7%. Jefferson is 12.8%, which is a smaller share but the biggest number in the state — 75,350 no-party voters in one county, more than the entire registered population of all but seven Kentucky counties.
And then look at the other end. Magoffin 3.3%. Clinton 4.0%. Breathitt 4.3%. Clay, Owsley, under 5%. The counties where the Democratic column is a filing cabinet are also the counties where nobody registers as anything else. The no-party voter is a suburban, college-town, military-base phenomenon, and it's the same map as the counties that grew since May. That's not a coincidence. It's the same people.
Whether they vote. Here's the number that should be on every campaign manager's wall.
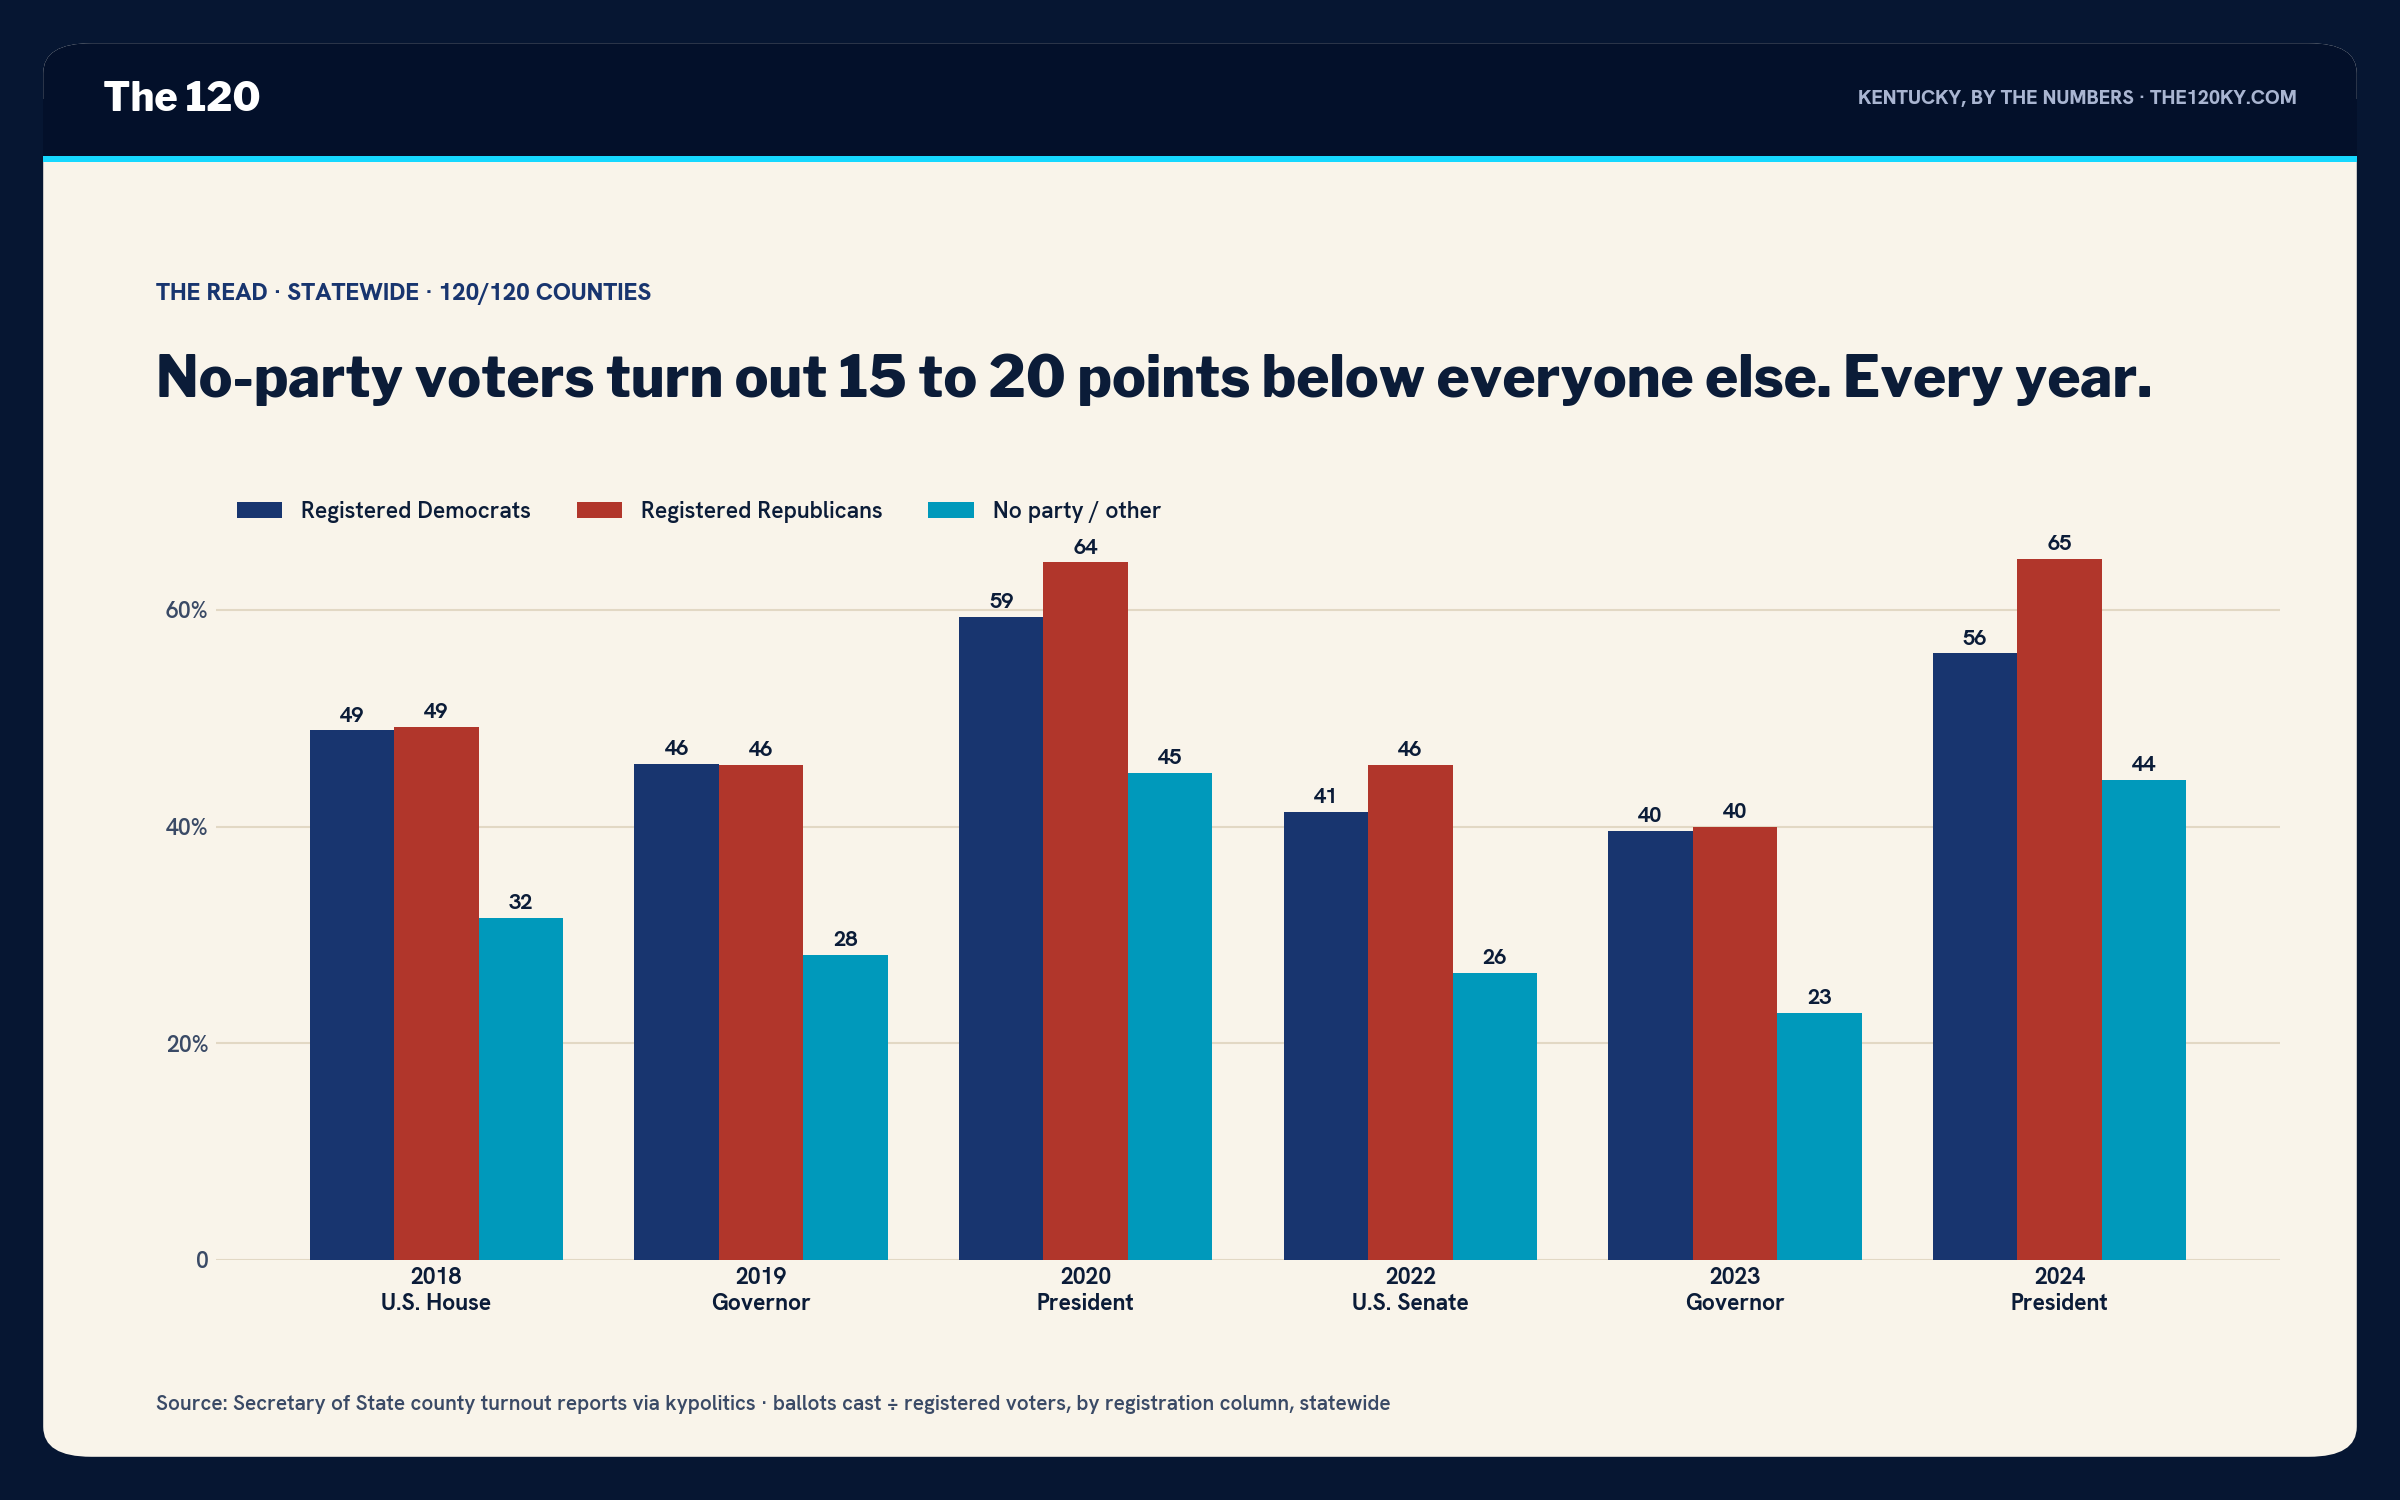
In 2022, the last Senate midterm, registered Republicans turned out at 45.7%, registered Democrats at 41.4%, and no-party voters at 26.5%. In 2024 it was 64.7, 56.0 and 44.3. In 2018 — the good Democratic year — 49.2, 48.9 and 31.6. Pick any year since 2010 and the gap is between fifteen and twenty points. It doesn't close in a Beshear year (2023: 40.0, 39.6, 22.8). It doesn't close in a presidential year. It's structural: people who didn't pick a party when they registered are, on average, people who don't think about elections until one is on top of them, and half of them never get there.
26.5%
No-party turnout in the 2022 U.S. Senate election, against 41.4% for registered Democrats and 45.7% for registered Republicans
Secretary of State county turnout reports, all 120 counties. In 2024 the no-party rate was 44.3%, still 12 to 20 points behind the two parties.
What that costs. Take each county's no-party voters and ask how many more of them would have voted in 2022 if they'd turned out at the combined major-party rate in that same county. Statewide the answer is 59,576 ballots. Jefferson is 9,865 of them. Fayette 4,420. Kenton 2,618, Boone 2,167, Hardin 1,997, Warren 1,860, Campbell 1,745.
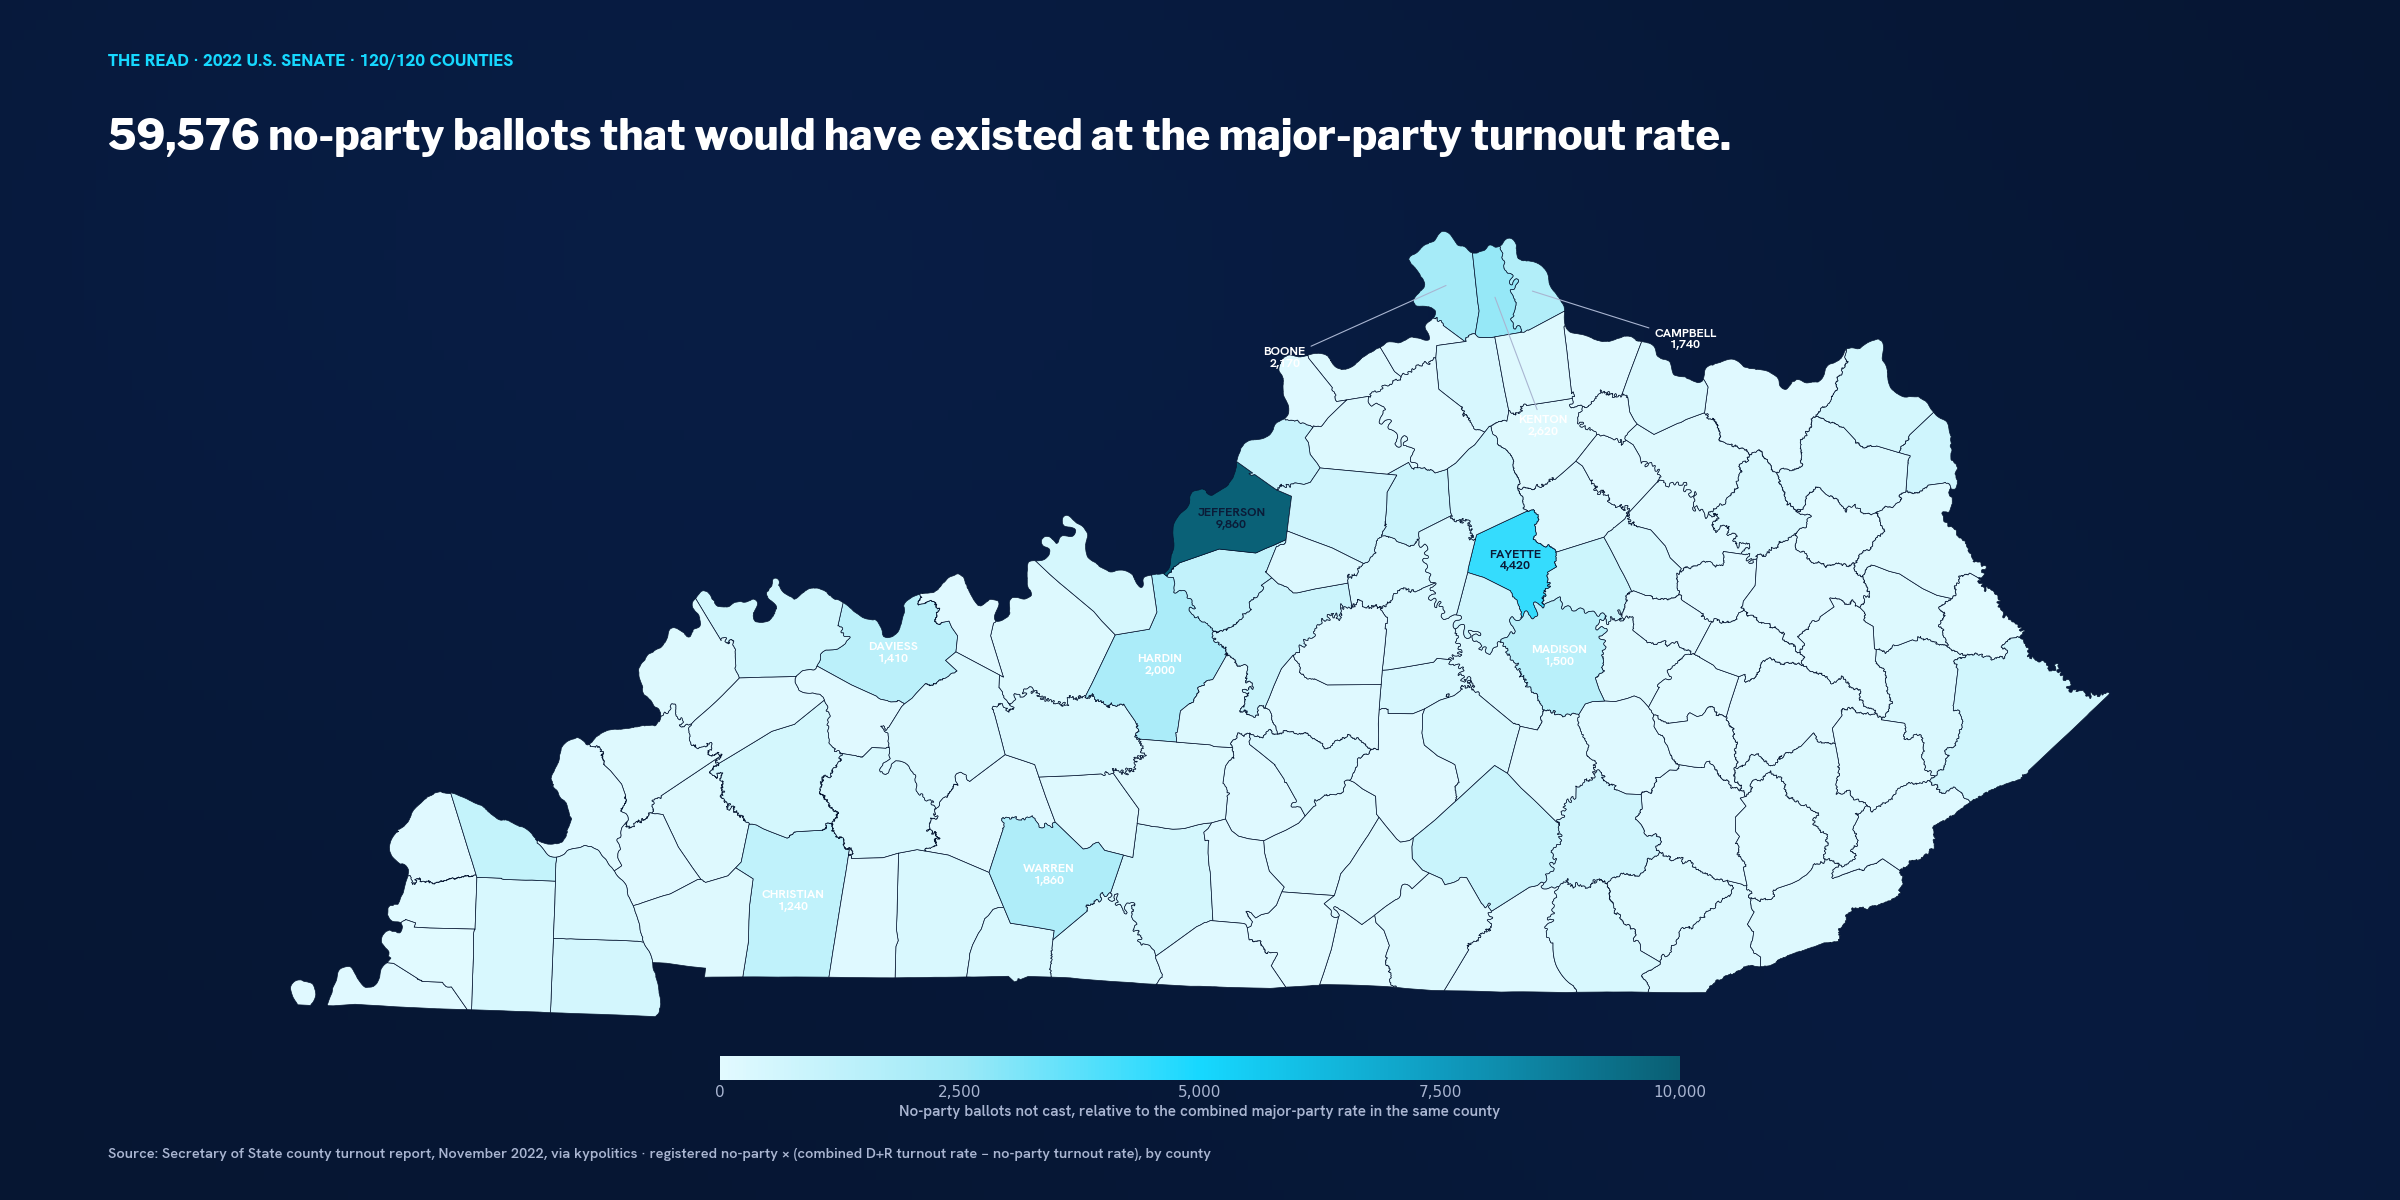
Put that next to the number I gave you ten days ago. The missing Democratic ballots in 2022 — registered Democrats who stayed home relative to the Republican rate — came to 74,669. The missing no-party ballots come to 59,576. They live in the same counties. Jefferson, Fayette, Kenton, Boone, Warren, Hardin, Campbell, Madison. The two biggest pools of uncollected votes in Kentucky are sitting on top of each other in eight counties, and one of them has no party label, no party mail, no party door-knocker, and no place in either side's universe.
74,669 missing Democrats. 59,576 missing no-party voters. Same eight counties. One of those pools has a party working it. The other has nobody.
The honest part, in two pieces. First: I don't know how they vote. That's the whole point of the column — there's no label to read. What I can tell you is where they live, and where they live is not neutral. Kenton and Boone went Trump by 22 and 37 points; the no-party voters there are, on the evidence of the county, mostly people who'd vote Republican if they voted. Jefferson went Harris by 16; the 75,350 there lean the other way. Fayette, Harris +18, same. The no-party column is not a swing bloc. It's two blocs that cancel statewide and don't cancel at all inside a legislative district. In the east end of Louisville, in Senate District 36, there are 12,079 of them in a district Trump carried by 1,323 votes. In Oldham, 7,340 in a Senate district where the swing precincts moved by 3,000. Those are the places the column is the margin, and both parties are treating it as noise.
Second: you cannot GOTV a no-party voter the way you GOTV your own. Your own list is people who told the county clerk which team they're on. These are people who specifically declined to. A party's mail reads as junk to them, a party's canvasser is a stranger, and the primary — the one contact most campaigns make before September — literally excludes them. The way you reach them is the candidate, the issue, and the neighbor, in that order, which is to say the way you reach anybody who isn't already yours. The difference is that there are 386,382 of them, they're concentrated in the counties where the legislative map is decided, and half of them are waiting for a reason.
What I'm watching. Three numbers when the clerks report in November. The no-party turnout rate in Jefferson County, which was 31.4% in the 2022 midterm and 44.0% in 2024 — if it comes in over 35%, the general electorate in Louisville looks different from any midterm I've seen. The same rate in Kenton and Boone, where it was 26 and 29 — that's the Republican side of the same question. And the share of all ballots cast by no-party voters, which was 6.2% in 2022; at 8% the column has become a factor, and at 10% it decided something.
Ten days ago I wrote that the paper freezes on October 5 and the math doesn't. This is the math. The parties are fighting over two columns. The third one is a ninth of the state.
Disclosure: I work in Kentucky Democratic politics and consult campaigns in this state. I read this file the same way whether or not it's good news for my side — that's the job. Registration figures are the Secretary of State's county report for August 2026, all 120 counties; "no party / other" is total registration less the Democratic and Republican columns and includes minor-party registrants. Turnout rates are ballots cast by registered voters of each column divided by that column's registration, from the Secretary of State's post-election county reports, 120 of 120 counties in every year shown.