The read · Turnout
The missing Democrats aren't in the mountains.
In a Trump-era federal election, registered Republicans in Kentucky turn out four to nine points better than registered Democrats. In a Beshear election the gap disappears. Two maps show where the gap actually lives — and it isn't where the map sends your eye first.
LOUISVILLE — Every county clerk in Kentucky reports the same thing after an election, and almost nobody reads it: how many registered Democrats voted, how many registered Republicans voted, and how many of each were on the rolls to begin with. Not who they voted for — just who showed up. I have that report for all 120 counties for every general election since 2010, and seven weeks out from a Senate midterm, it is the single most useful thing on my desk.
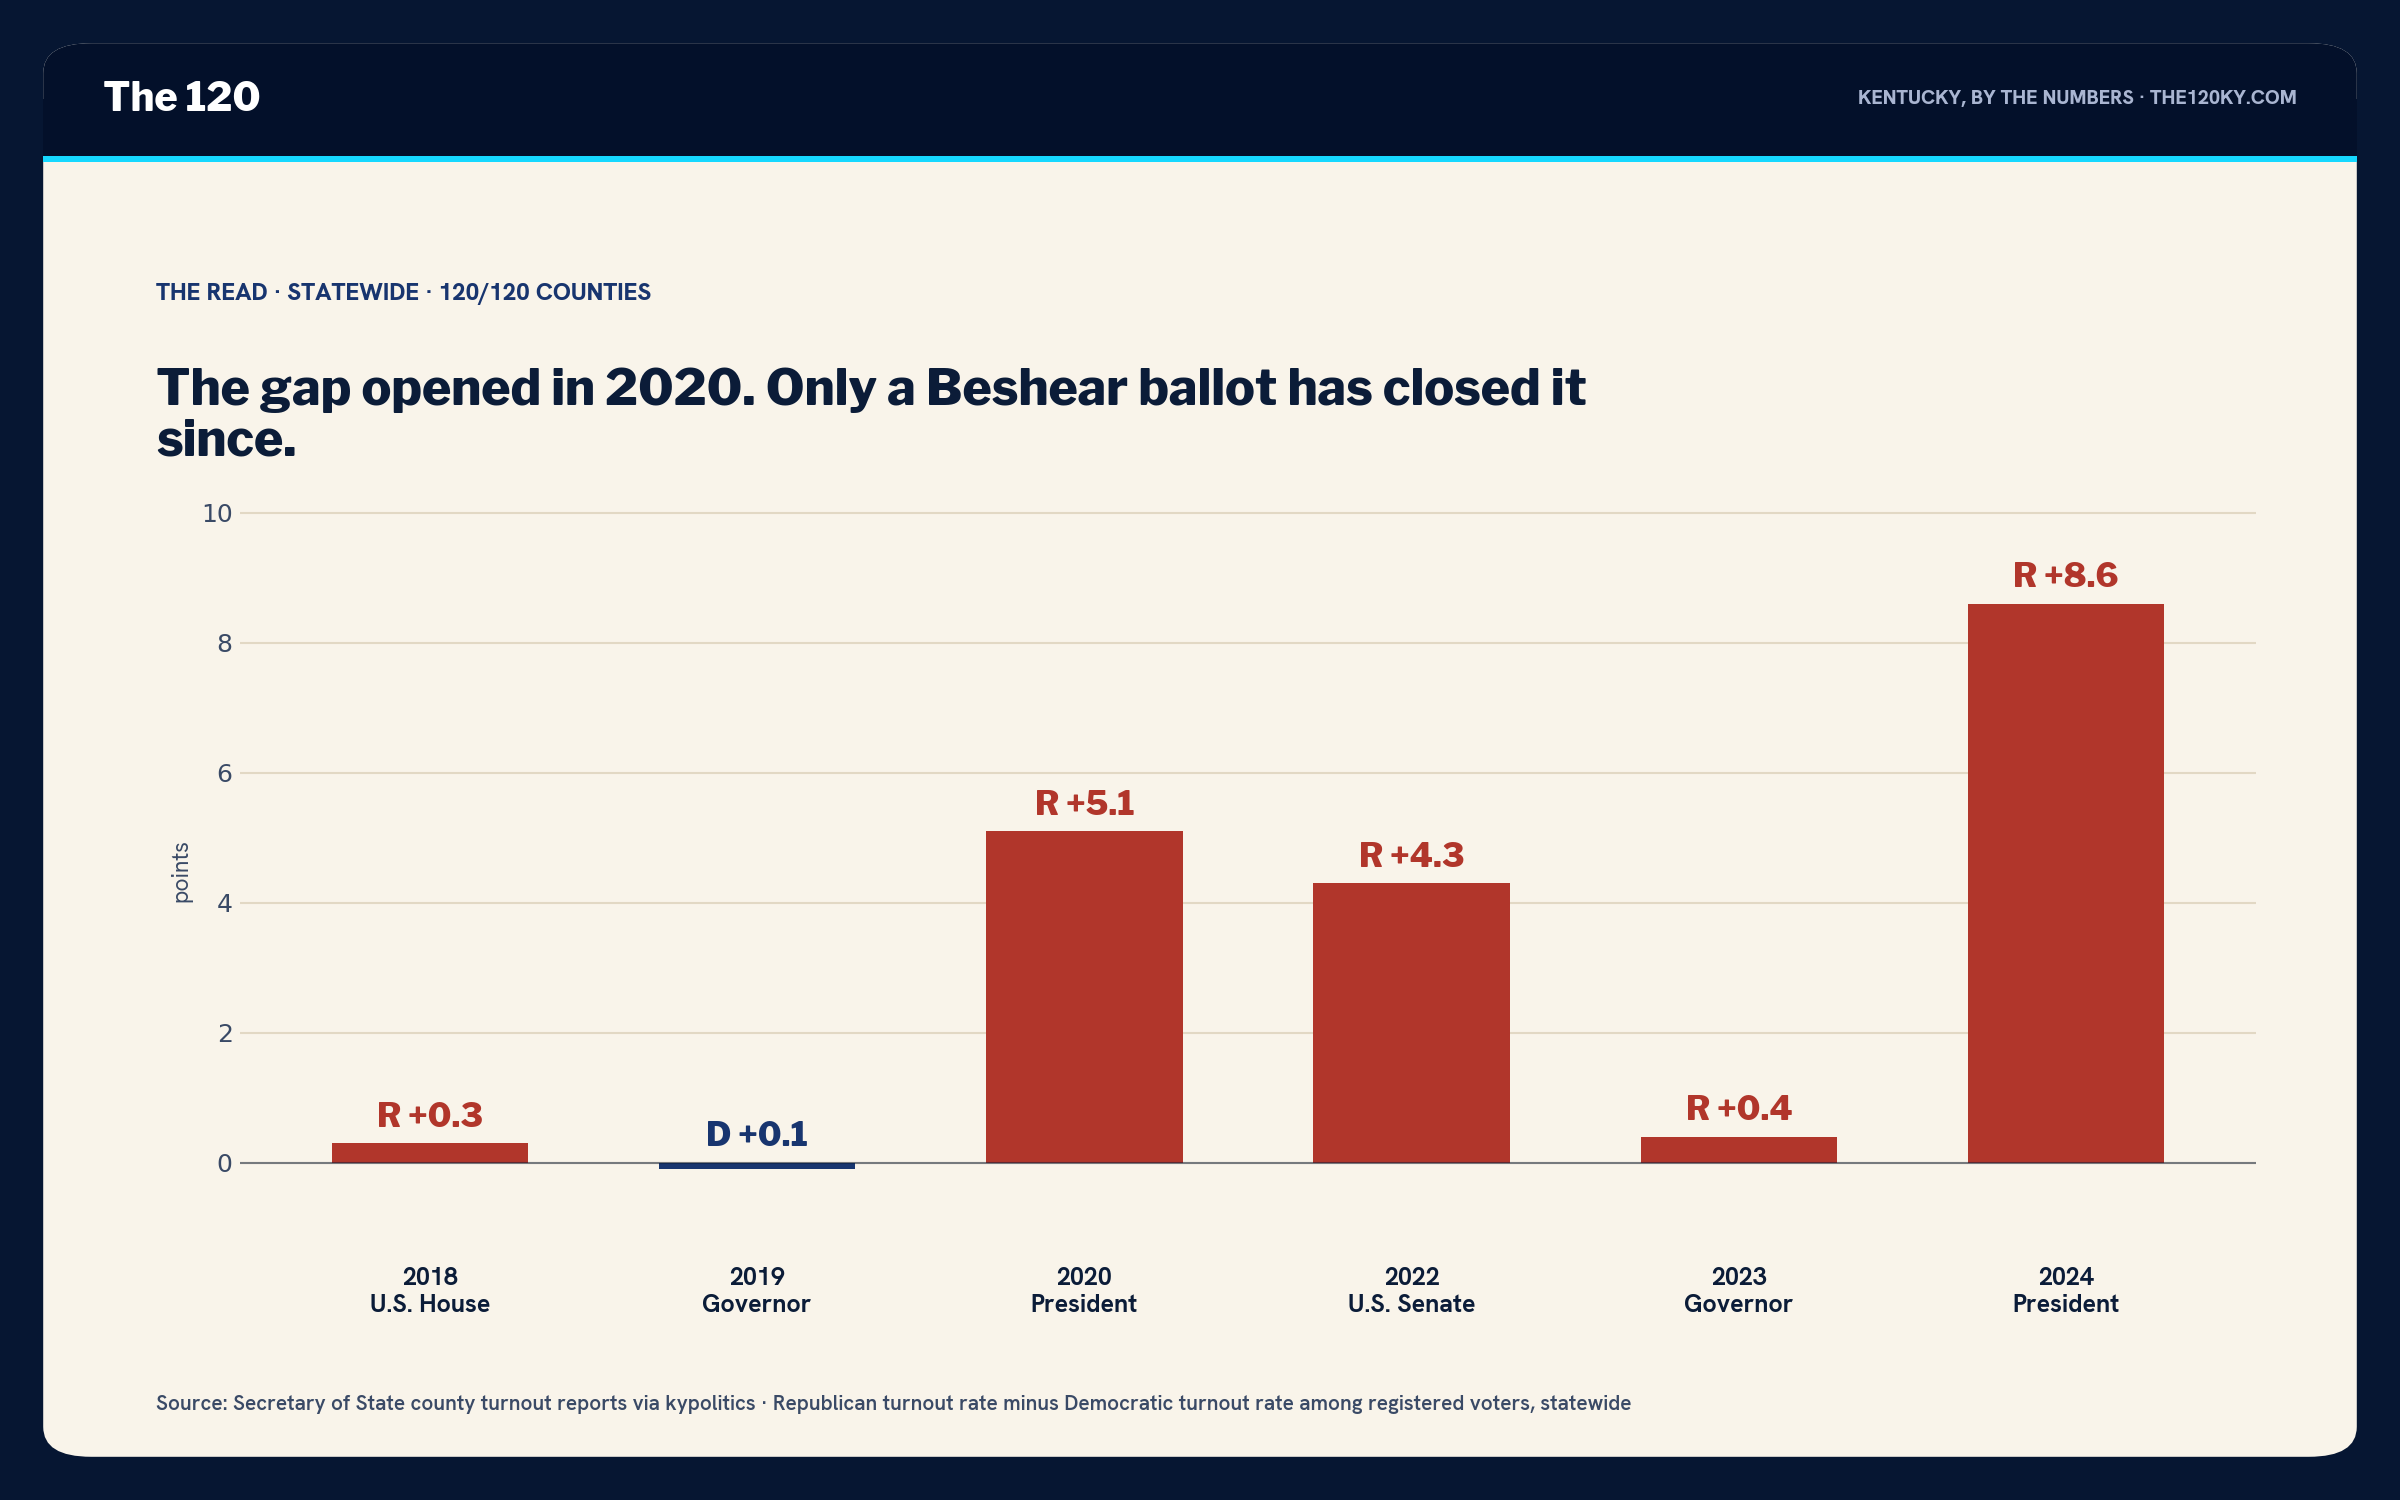
Here's what it says. In November 2022, the last time Kentucky elected a U.S. senator, 45.7% of registered Republicans cast a ballot and 41.4% of registered Democrats did. A gap of 4.3 points. Twelve months later, same rolls, same counties, Andy Beshear on the ballot: Republicans 40.0%, Democrats 39.6%. A gap of 0.4. Then Trump came back in 2024 and it blew open to 8.6.
Two things to get straight before the maps, because both cut against the easy read.
First, this is not an old pattern. In 2018 — a Trump midterm, a good Democratic year nationally — registered Democrats and Republicans in Kentucky turned out within three-tenths of a point of each other. In 2019 the Democrats turned out slightly better. The gap is a 2020 invention. Something about a Trump-era federal ballot gets Kentucky Republicans to the polls at a rate the Democratic column can't match, and something about a Beshear ballot brings the Democratic column all the way back. Same people. Same rolls. Different reason to leave the house.
Second, a turnout gap is not a vote gap. In 2022 Rand Paul beat Charles Booker by 349,026 votes. If every registered Democrat in every county had turned out at the Republican rate in that county, the state would have cast 74,669 more Democratic-registered ballots — and even if every one of them had gone to Booker, which they wouldn't have, he loses by 274,000 instead. The gap is real. It is not why he lost. I'll come back to that at the end.
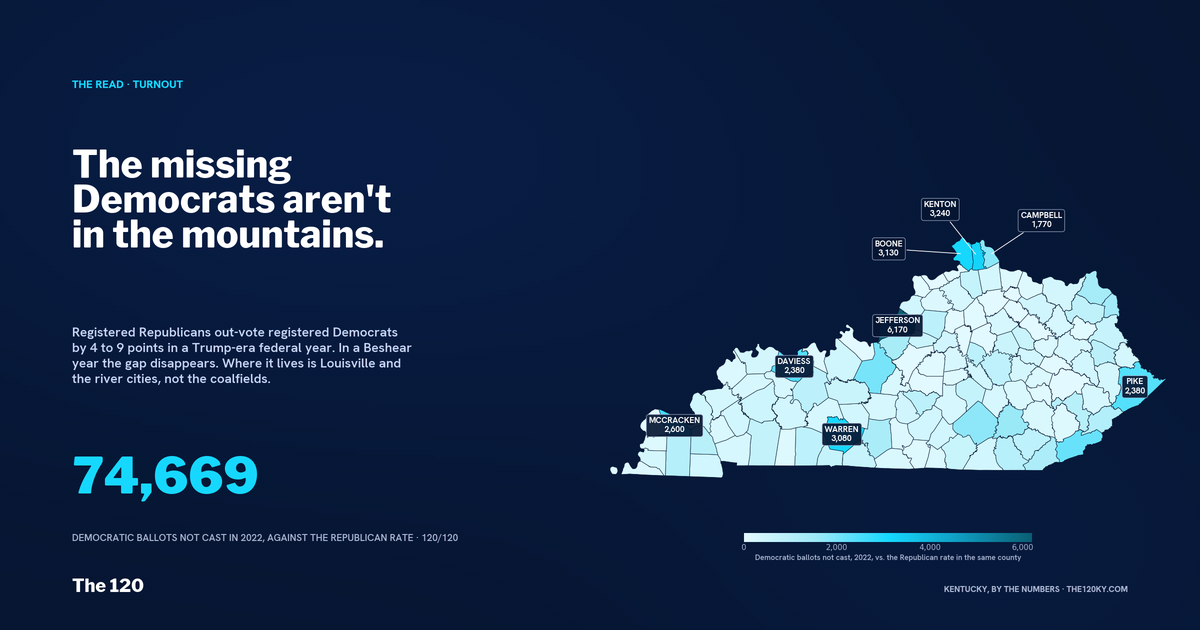
74,669
Democratic-registered ballots not cast in 2022, relative to the Republican turnout rate in the same county
Secretary of State county turnout reports, all 120 counties. The 2024 figure was 113,531. Neither number decides a Senate race. Both decide the state House.
Now the maps, because this is where the story turns.
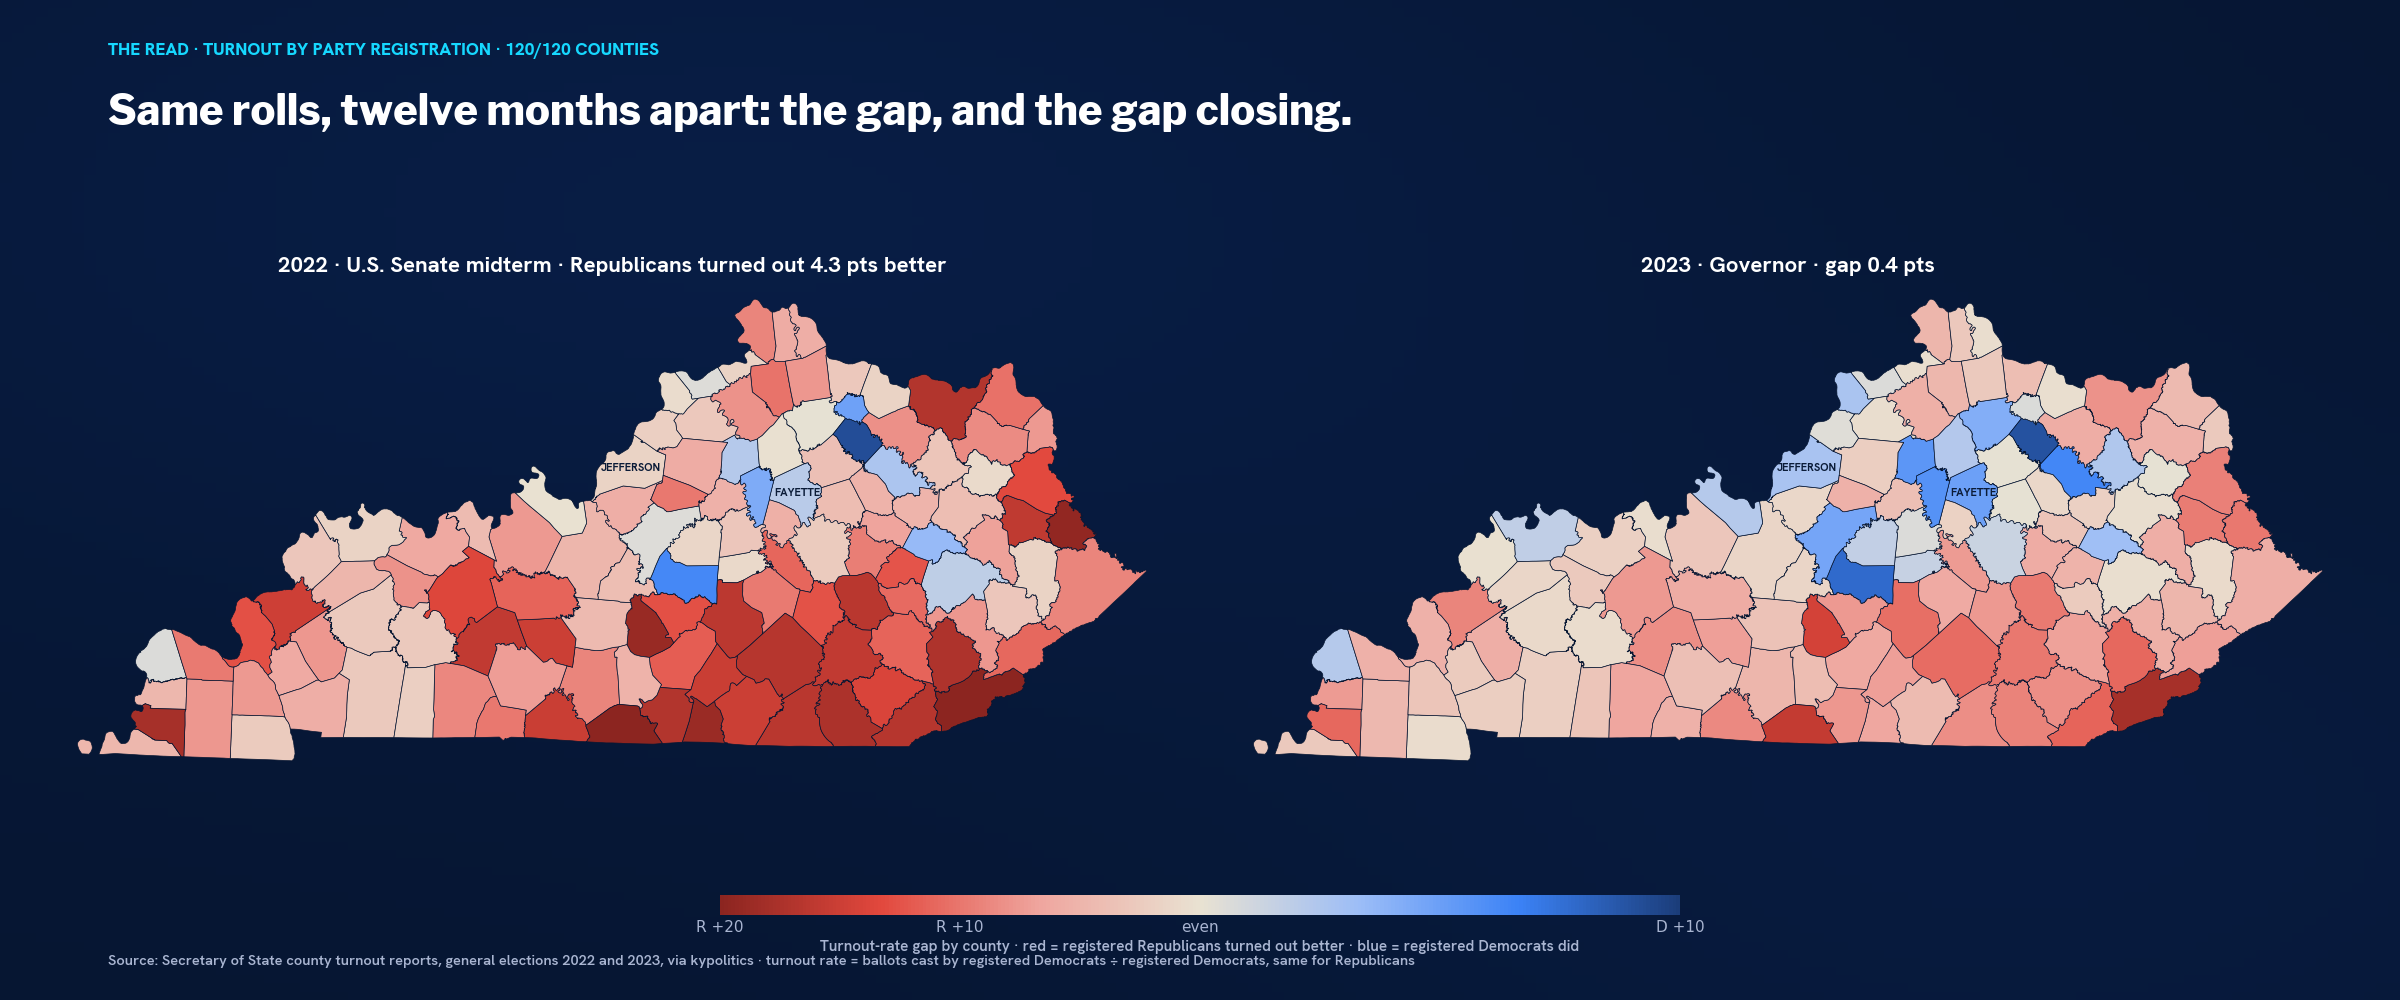
Look at the 2022 map and the eye goes straight to the red band along the Tennessee line and up through the coalfields. Harlan County: registered Republicans turned out at 51.5%, registered Democrats at 25.8%. A 25.6-point gap, the widest in the state. Martin, 19.4. Monroe, 20.5. Clinton, Whitley, Leslie, Bell, all north of sixteen. Read that map the way most people would and you'd say the Democratic turnout problem is an Appalachian problem, and you'd send the buses east.
Here's the part the consultants will get backwards. Those aren't Democrats. Harlan has 8,430 registered Democrats and 2,179 of them voted in 2022 — and Charles Booker got 1,333 votes in the entire county. The registered Democrats who did show up mostly voted for Rand Paul. The ones who stayed home would have too. That red band is the registration lie I wrote about last week, drawn as turnout: a column full of people whose grandparents were Democrats, who have voted Republican for a decade, and who have no particular reason to show up for a federal Democrat. A "gap" there is not a gap. It's a photograph of a party that already left.
You can't turn out a registration. You can only turn out a person. In the mountains the registration is still there and the person has been a Republican since 2016.
So throw out the percentages and count bodies instead. Take the gap in each county, multiply it by the registered Democrats in that county, and ask where the missing ballots actually are — not where the rate is worst, but where the most Democrats who would plausibly vote Democratic stayed home.
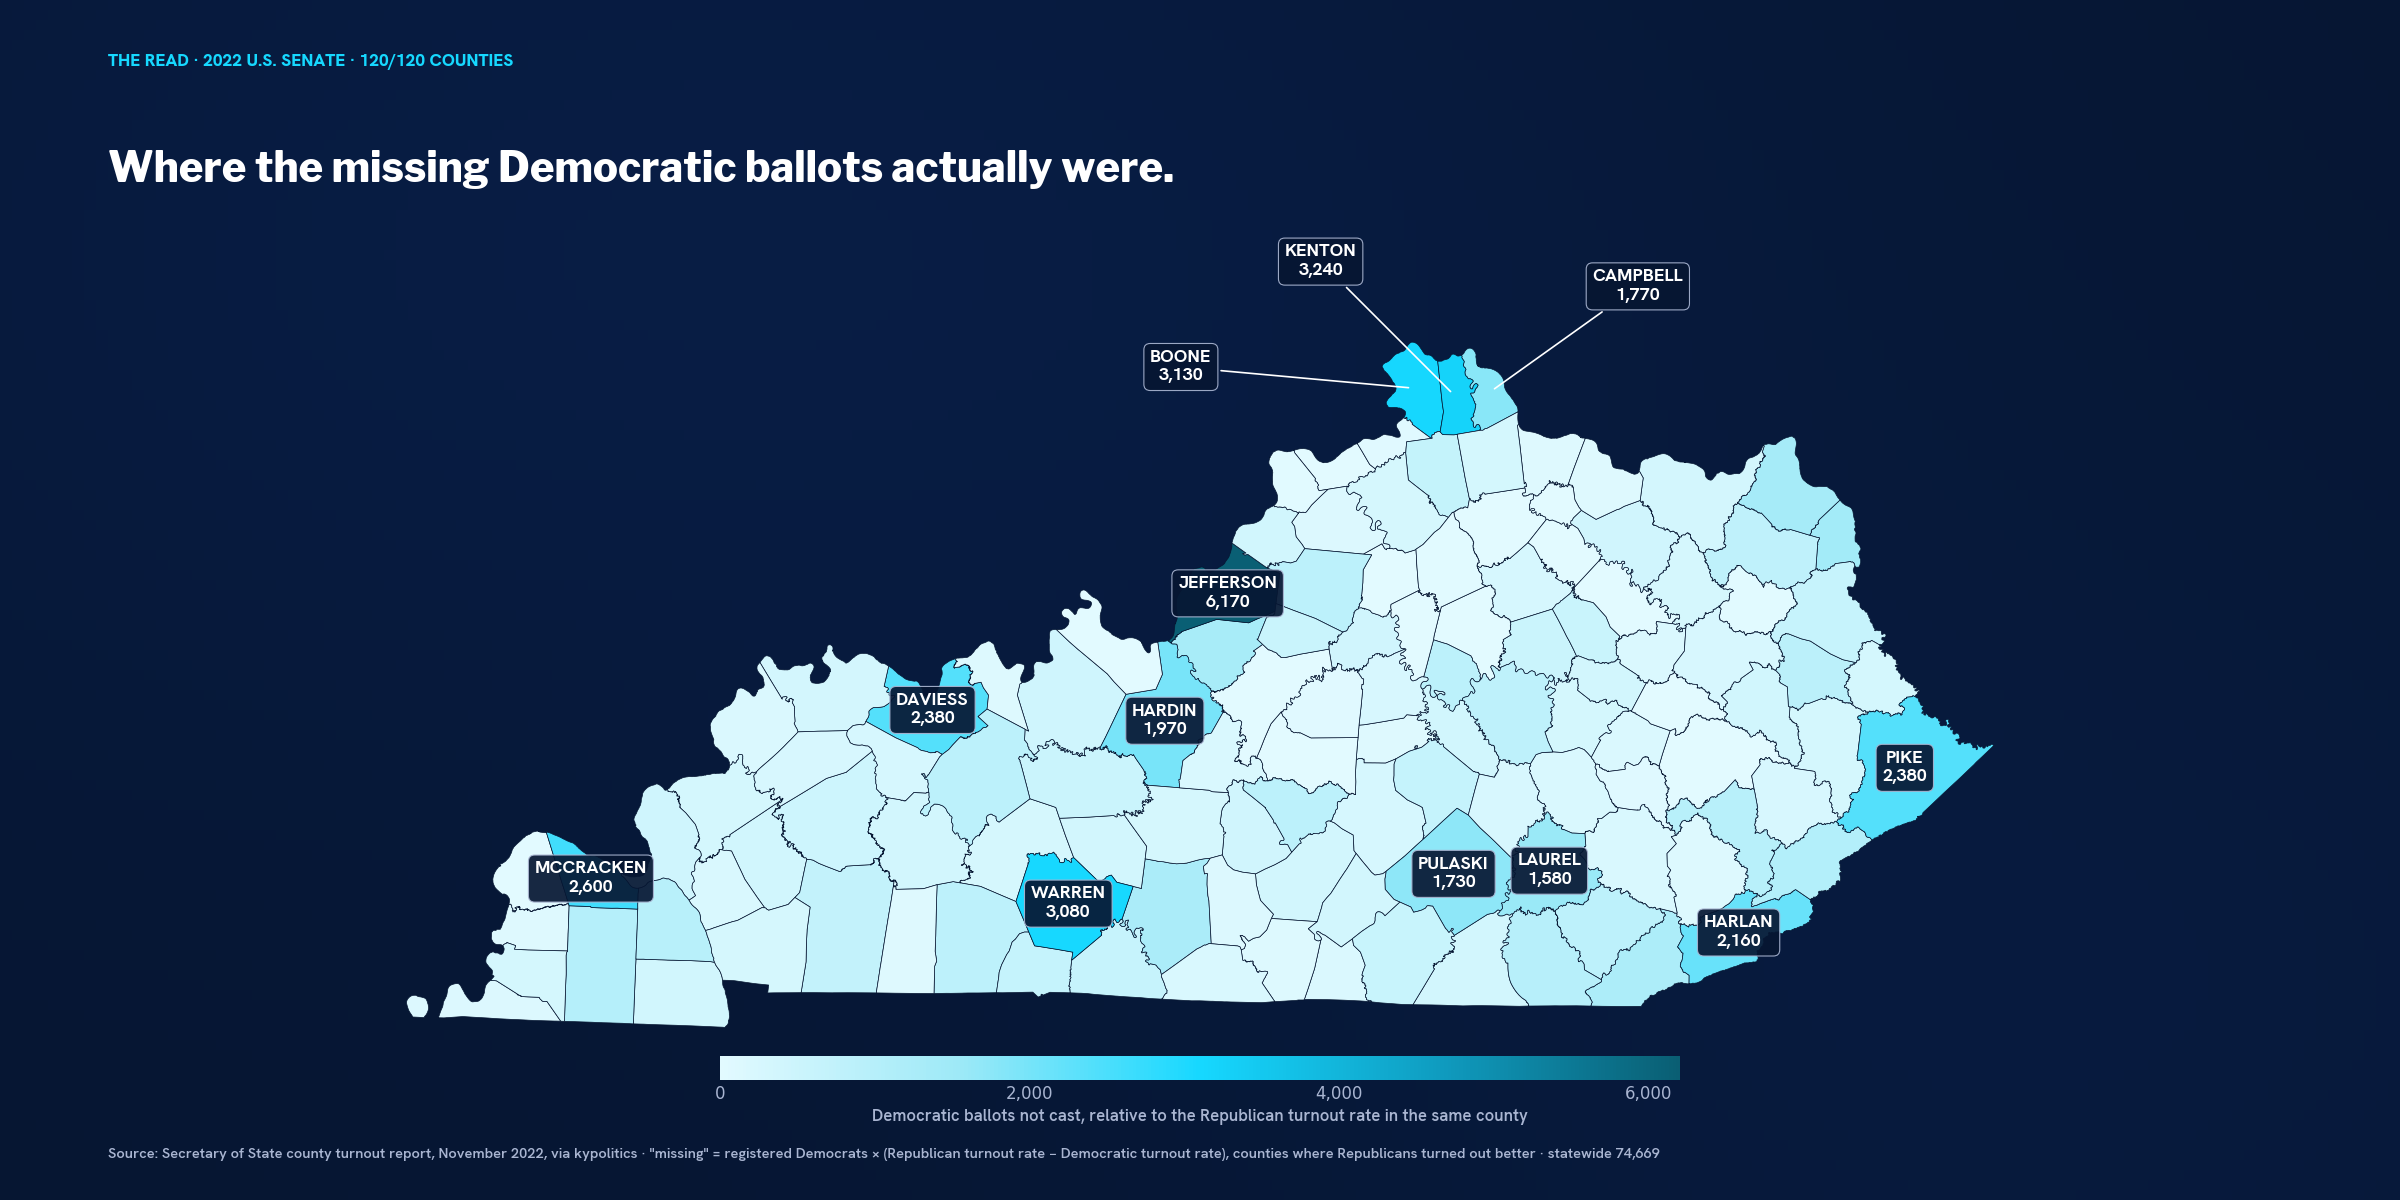
The map flips. Jefferson County, where the gap was only 1.7 points, is worth 6,172 ballots, because a small gap times 361,703 registered Democrats is a big number. Kenton, 3,237. Boone, 3,135. Warren, 3,079. McCracken, 2,605. Daviess, 2,379. Hardin, 1,968. Campbell, 1,775. Those eight counties alone are 24,000 ballots, a third of the statewide total, and unlike Harlan, the Democrats in them vote Democratic: Booker took 59.1% of Jefferson, 41.2% of Kenton, 40.2% of Warren. In Boone County registered Democrats turned out at 35.6% against a Republican rate of 44.6. In Kenton, 34.6 against 40.6. In Warren, 39.6 against 46.9. Those are real Democrats, in real numbers, who did not vote in a Senate race.
Pike and Harlan still make the top ten by bodies — I'm not going to pretend they don't — but the honest read of the eastern number is that most of it is uncollectable, and the honest read of the Northern Kentucky number is that all of it is.
Then look at what 2023 did to the same map. Jefferson: Democrats 44.1%, Republicans 41.4 — the gap didn't close, it reversed. Fayette, 46.7 to 41.7. Franklin, 52.8 to 47.3. Oldham, Scott, Madison, all flipped to Democrats turning out better. The number of counties where the Democratic column out-turned the Republican one went from 13 to 26. The Northern Kentucky suburbs narrowed — Boone from 9.0 to 4.9, Kenton from 6.0 to 3.0 — but never flipped. And the coalfields barely moved at all, because there was never a Democratic voter there to move.
That's the tell, and it's a hopeful one if you read it straight. The Democrats who are missing in a federal year exist. They live in Louisville, Lexington, the Bluegrass counties, and the river cities, and they voted in 2023. They didn't fall off the rolls. They didn't become Republicans. They stayed home for Charles Booker and Kamala Harris and came out for Andy Beshear, which tells you the problem isn't turnout machinery. It's the name on the ballot and the reason to go.
What the polls can and can't tell you. There is exactly one public poll of this race since the primary, and it's the Booker campaign's own: Global Strategy Group, August 24–27, 600 likely voters, Barr 49, Booker 40, a third of the sample saying they could still change their minds. No independent pollster has been in the field. The one number worth carrying from it is the 40, which sits right where the last two Democratic Senate runs finished, and the one thing worth remembering about it is who paid for it. Nationally, the picture is what you'd expect for a first midterm under a Republican president: a UMass poll fielded the same week found 42% of Democrats "very enthusiastic" about voting against 30% of Republicans. The last Kentucky-specific read on the president, Emerson in February, had him at 53% approval here.
So here's the temptation, and I'm naming it so I can refuse it: to read that enthusiasm gap and write that Republicans are going to stay home. The clerks' reports say something more useful. Go back to 2018 — the last midterm with a Republican in the White House, and the last time the gap was zero. Republicans did not stay home. Their turnout rate was 49.2%, higher than 2014's, higher than 2022's. What closed the gap was Democrats rising to meet them, 47.1 to 48.9. The same thing happened in 2023: Republicans fell to 40.0, and Democrats fell less. In sixteen years of these reports the gap has never once closed because Republicans quit. It closes when Democrats show up.
That is not a change of position from what I wrote in August. High turnout still isn't a side in Kentucky, and a Republican who's cooler on the president than he was is still a Republican who votes. The read that survives every one of these years is the boring one: the Democratic column's ceiling is set by the Democratic column, and nobody else is going to fill it.
Now the honest version. Closing the entire gap doesn't win a Senate race in this state. It didn't in 2022, and it wouldn't have in 2024, when the gap was twice as wide and the margin was wider still. What it does is decide everything underneath the Senate line. The Jefferson County House seat I wrote about in August turned on 340 votes. The state Senate map has districts that move on two thousand. A Metro Council district is a few hundred. Six thousand missing Democrats in Jefferson County is not a rounding error on a Senate race; it's the whole margin in three or four legislative seats, and it's sitting in precincts where a campaign can go knock.
So the question for this fall isn't "can Democrats close the gap statewide." It's which campaigns know their own county's number. If you're running in Kenton County, your number is 3,237. In Warren, 3,079. In Daviess, 2,379. Find your county on the second map, and that is the size of the electorate that voted for Beshear and skipped Booker — the people who will decide whether you win by two hundred or lose by four.
What I'm watching in November is one figure from the clerks' reports, county by county: the Democratic turnout rate in Jefferson, Kenton, Boone, Warren, and Fayette against the Republican one. If the gap in those five looks like 2023, the down-ballot map changes. If it looks like 2022, it doesn't, no matter what the Senate topline says.
The clerks will publish it either way. I'll be reading it for the gap, not the winner.
Disclosure: I work in Kentucky Democratic politics and consult campaigns in this state. I read this race the same way whether or not it's good news for my side — that's the job. Turnout rates here are ballots cast by registered voters of a party divided by that party's registration in the same county, from the Secretary of State's post-election county reports, all 120 counties in every year shown.