County Read No. 1 · Oldham County
Oldham County: Republican by 30, then by 22, then by 225 votes.
First in a series: the twenty biggest counties in Kentucky, one at a time, by the numbers. Oldham has gotten redder on paper every year since 2010 and bluer at the ballot box since 2016. In 2023 its registered Democrats out-voted its registered Republicans and Beshear lost the county by 225 votes. This fall, for the first time in the data, there's a Democrat on every legislative line of the ballot.
LOUISVILLE — This is the first of twenty. Kentucky has 120 counties and about twenty of them decide anything — the twenty biggest by registration hold 59% of the state's voters and nearly all of its competitive legislative seats. Between now and November I'm going to take every one of them apart the same way — this Friday and next, then every weekday once the calendar gets short: what the paper says, what the ballots say, who's turning out, what's on the ballot, and who's paying for it. Same five questions, same charts, twenty counties. I'm starting with Oldham because I wrote about its Senate district last week and readers wanted the rest of the county. The rest of the county is more interesting than the district.
What the paper says. Oldham County has 54,317 registered voters as of the August file: 29,901 Republicans, 17,076 Democrats, 7,340 in neither column. That's 55% Republican, 31% Democratic, 13.5% no-party. In 2010 it was 52% Republican, 38% Democratic. The county has added 14,000 voters in sixteen years and the Democratic column has added 1,800 of them; the Republican column added 8,900 and the no-party column nearly doubled. On paper, Oldham is a county that has gotten steadily, unremarkably more Republican for a decade and a half, and if that's all you looked at you'd file it next to Shelby and Spencer and move on.
What the ballots say. Here's why you shouldn't.
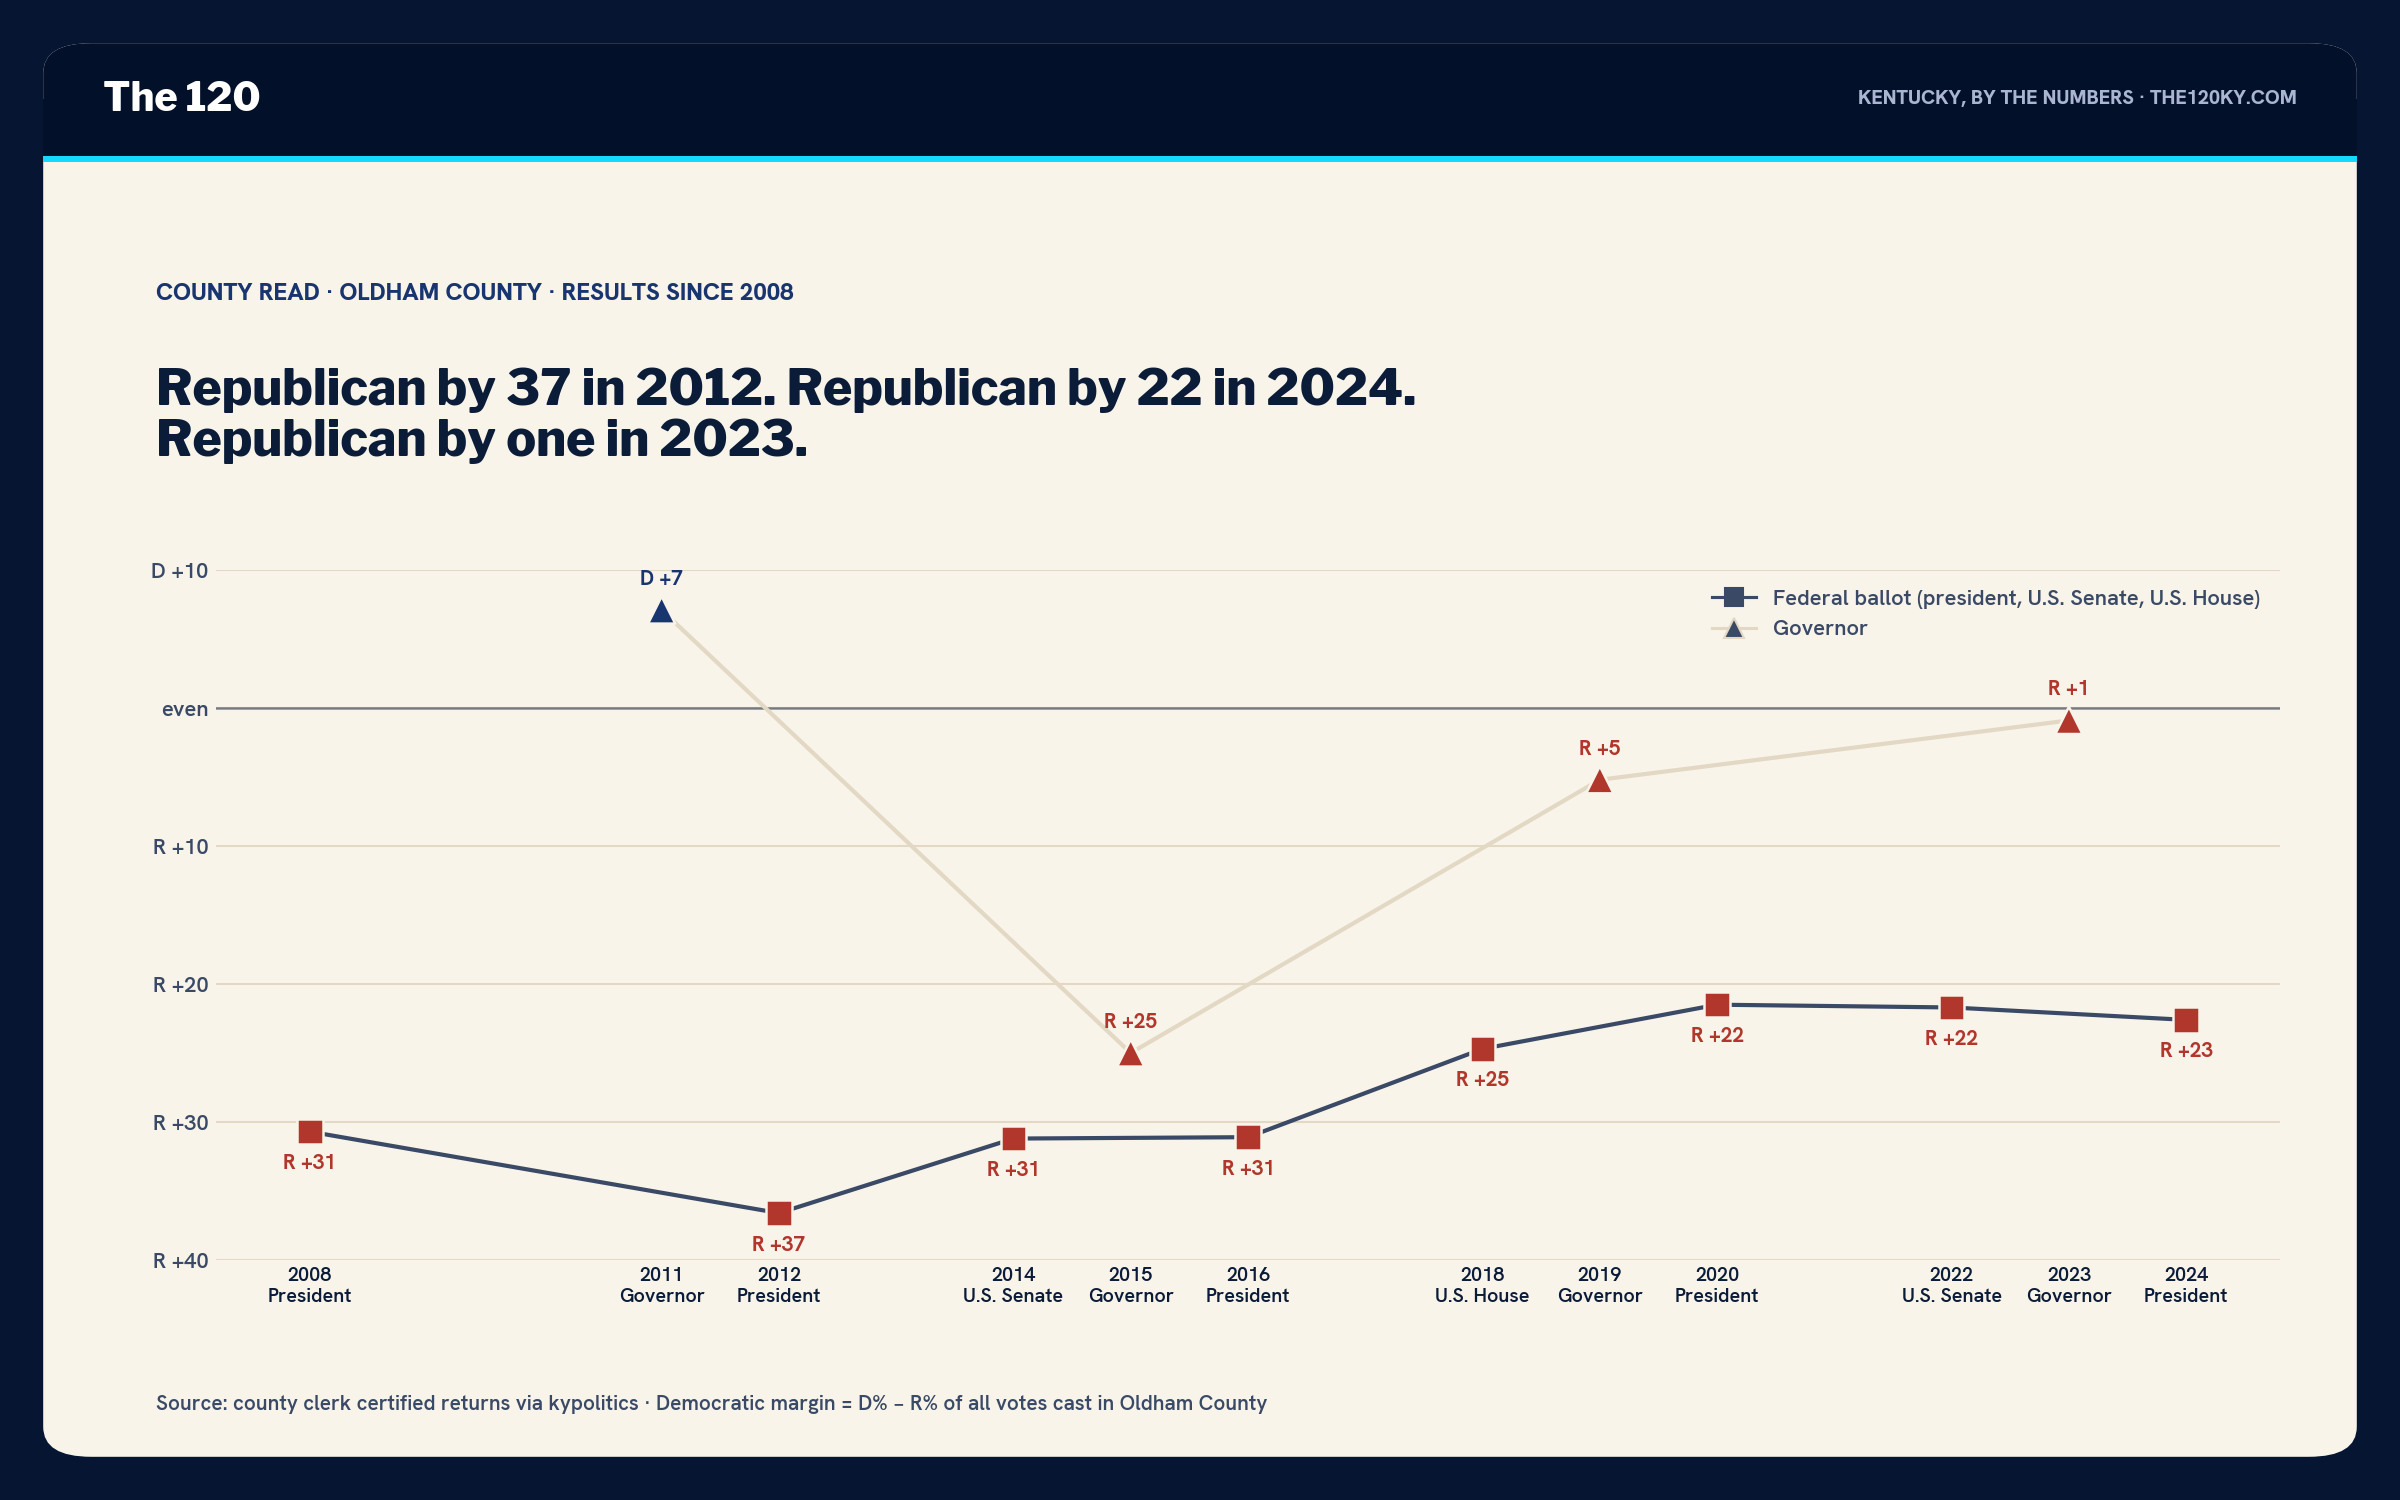
In 2012 Oldham County voted for Mitt Romney by 36.6 points. In 2016 it voted for Trump by 31. In 2020, by 21.5. In 2024, by 22.6. That's a fifteen-point move toward the Democrats on the federal ballot over three presidential cycles, in a county whose registration moved six points the other way. The governor's line is more dramatic: Bevin carried the county by 25 in 2015, by 5.2 in 2019, and in 2023 Cameron carried it by 225 votes — 13,177 to 12,952 — in a county Trump would carry by 8,623 twelve months later.
That's the Oldham County paradox, and it's the reason it gets the first county read. The registration says the county is becoming Shelby. The ballots say it's becoming Fayette's suburbs — a well-off, well-educated commuter county whose Republican voters are exactly the kind that moved away from Trump-era candidates in 2020 and moved toward Beshear in 2023 and haven't moved back. The paper is lagging the people by about a decade, which is the same thing I found in the Democratic column in eastern Kentucky, running the other direction.
Who's turning out. This is the number I'd put on the wall.
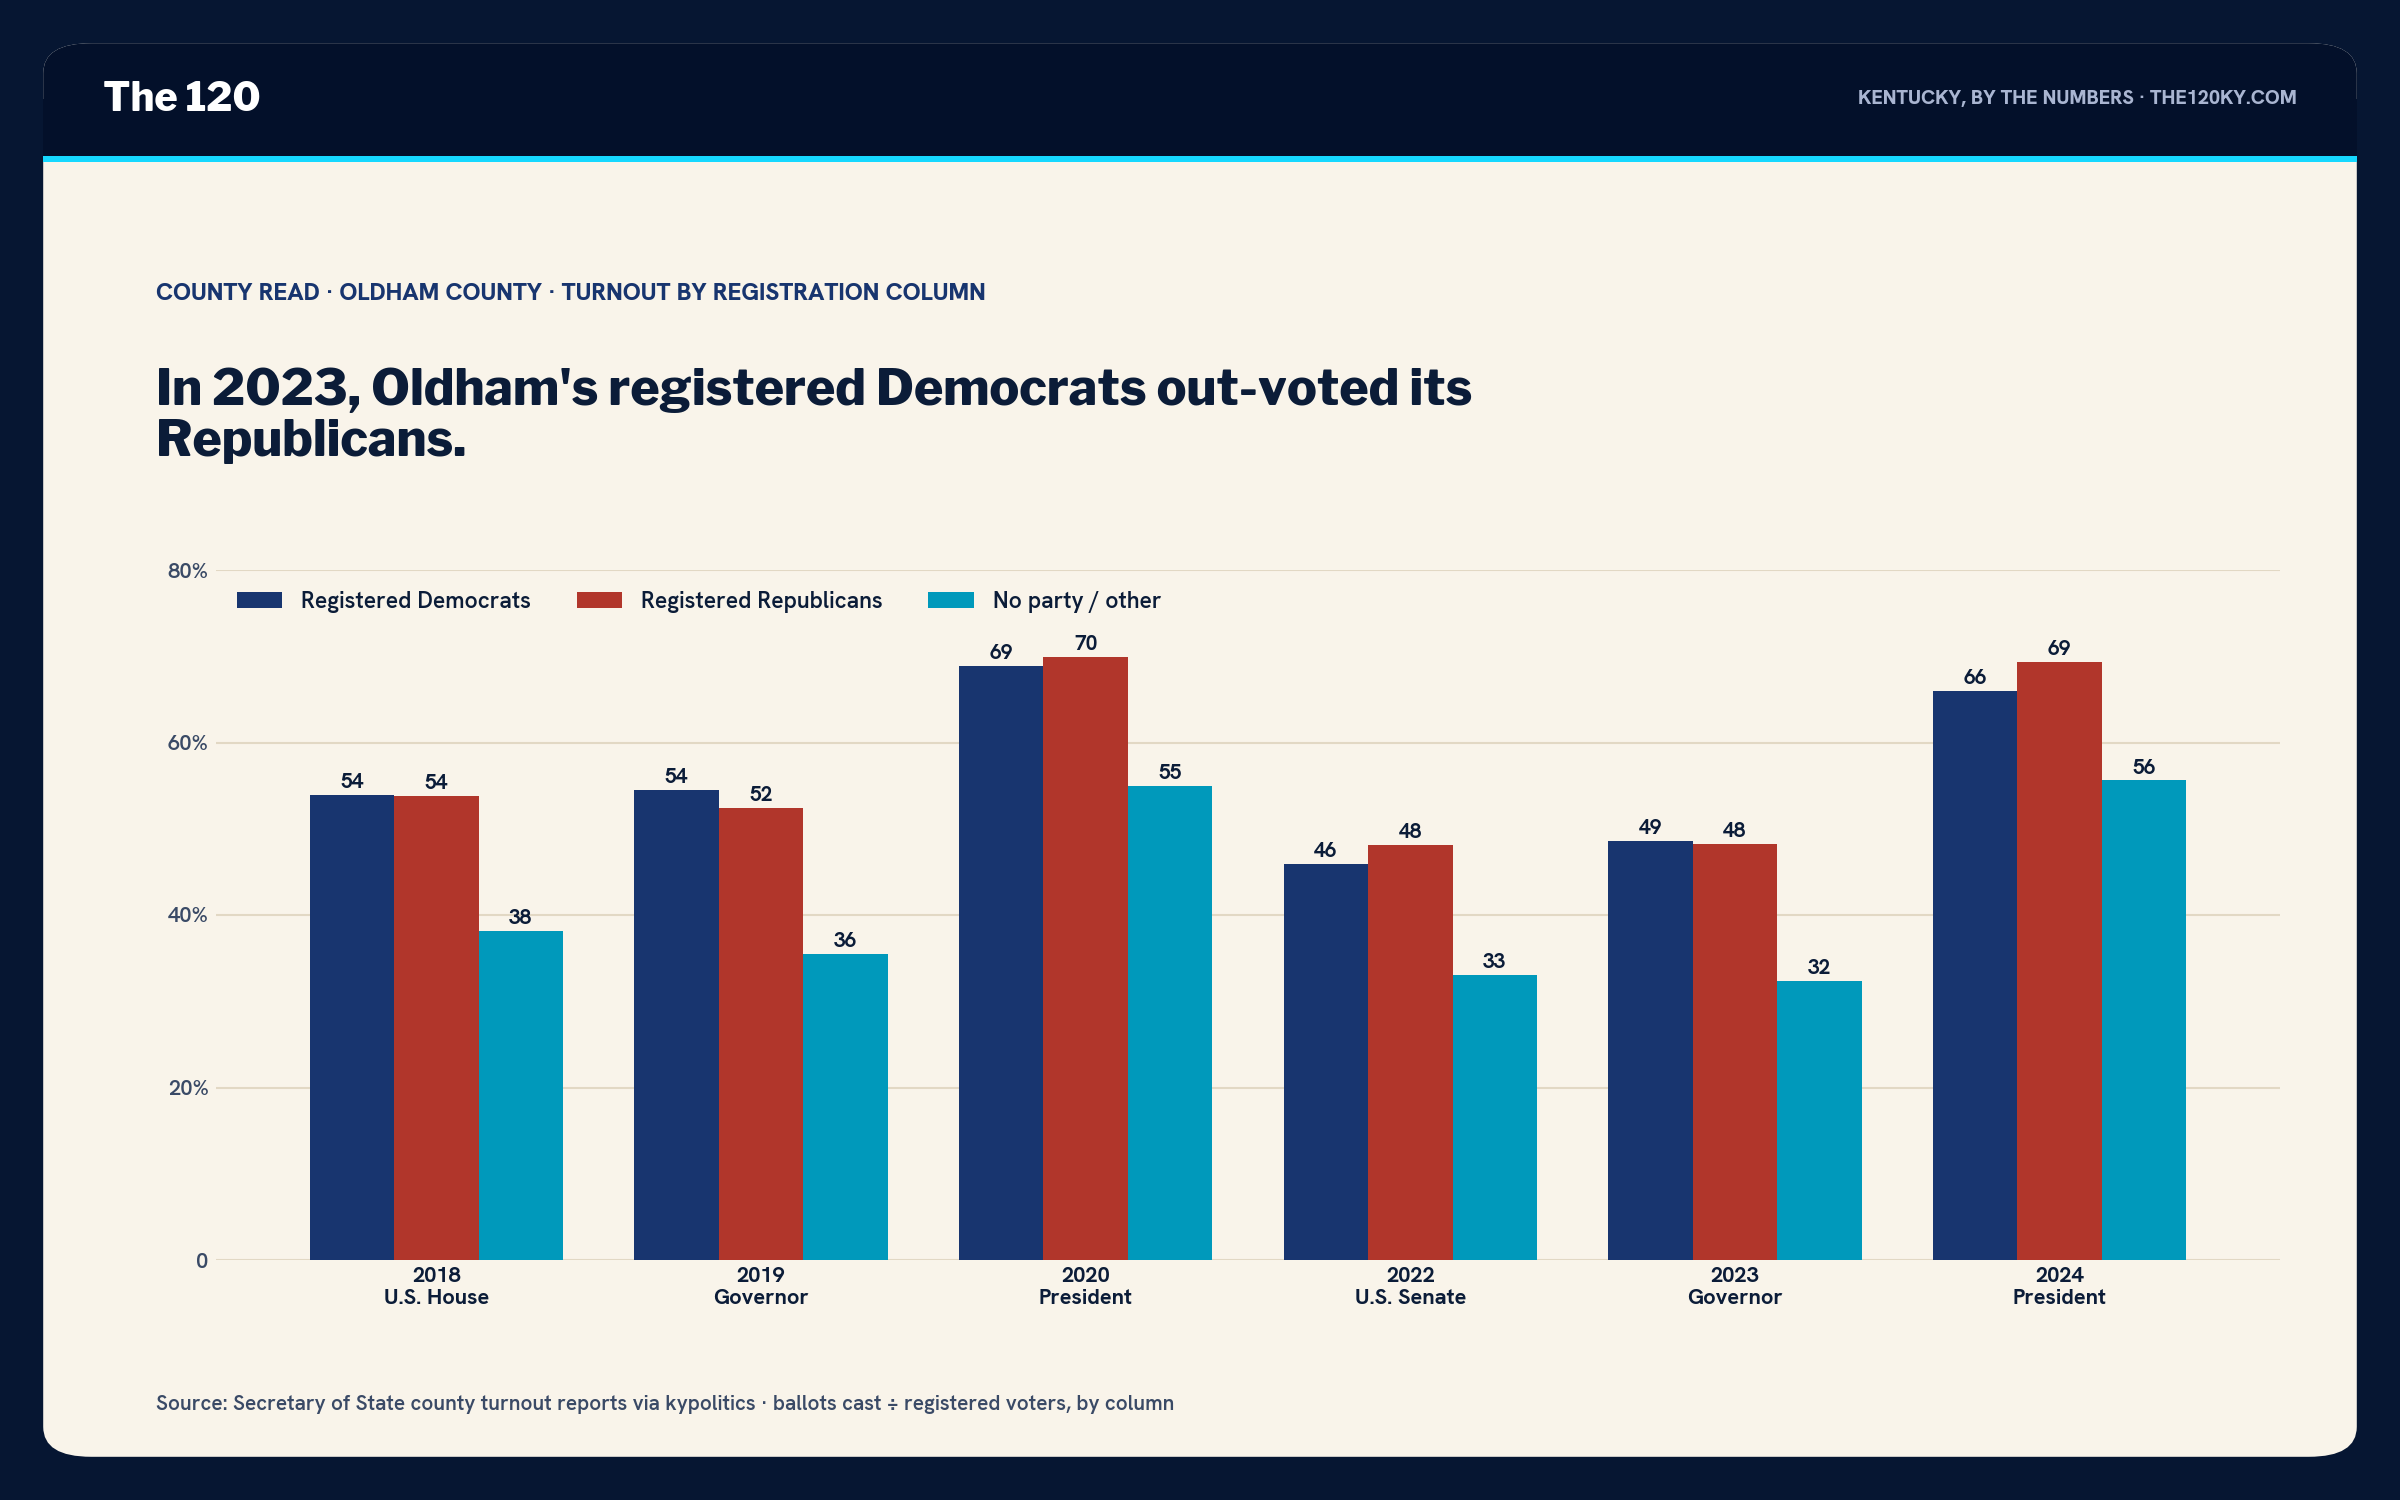
In 2023, 48.6% of Oldham's registered Democrats voted and 48.2% of its registered Republicans did. The Democrats out-turned the Republicans, in a 55–31 Republican county, and Beshear lost by 225. In 2019 it was 54.5 to 52.4, same result: a Democratic column that shows up better than the Republican one in a Beshear year and still loses, narrowly, because the column is 12,000 voters short. In the two federal midterm-style years, 2018 and 2022, the two columns turned out within two points of each other. The gap that I wrote about statewide two weeks ago — Republicans out-voting Democrats by four to nine points in a Trump-era federal year — barely exists in Oldham. Oldham's Democrats vote. There just aren't enough of them, and that's why the third column matters more here than almost anywhere.
The no-party column is 7,340 voters, 13.5% of the county, the seventh-highest share in the state. They turned out at 33% in 2022 and 32% in 2023 against 46–48 for the two parties. At the major-party rate they'd have cast about a thousand more ballots in 2023. Beshear lost by 225.
Oldham's registered Democrats out-voted its registered Republicans in 2023 and Beshear still lost by 225. The Democratic column isn't the problem here. The size of it is, and the third column is the only one that grows.
Where it happens. Thirty-eight precincts, and the three-election test splits them cleanly.
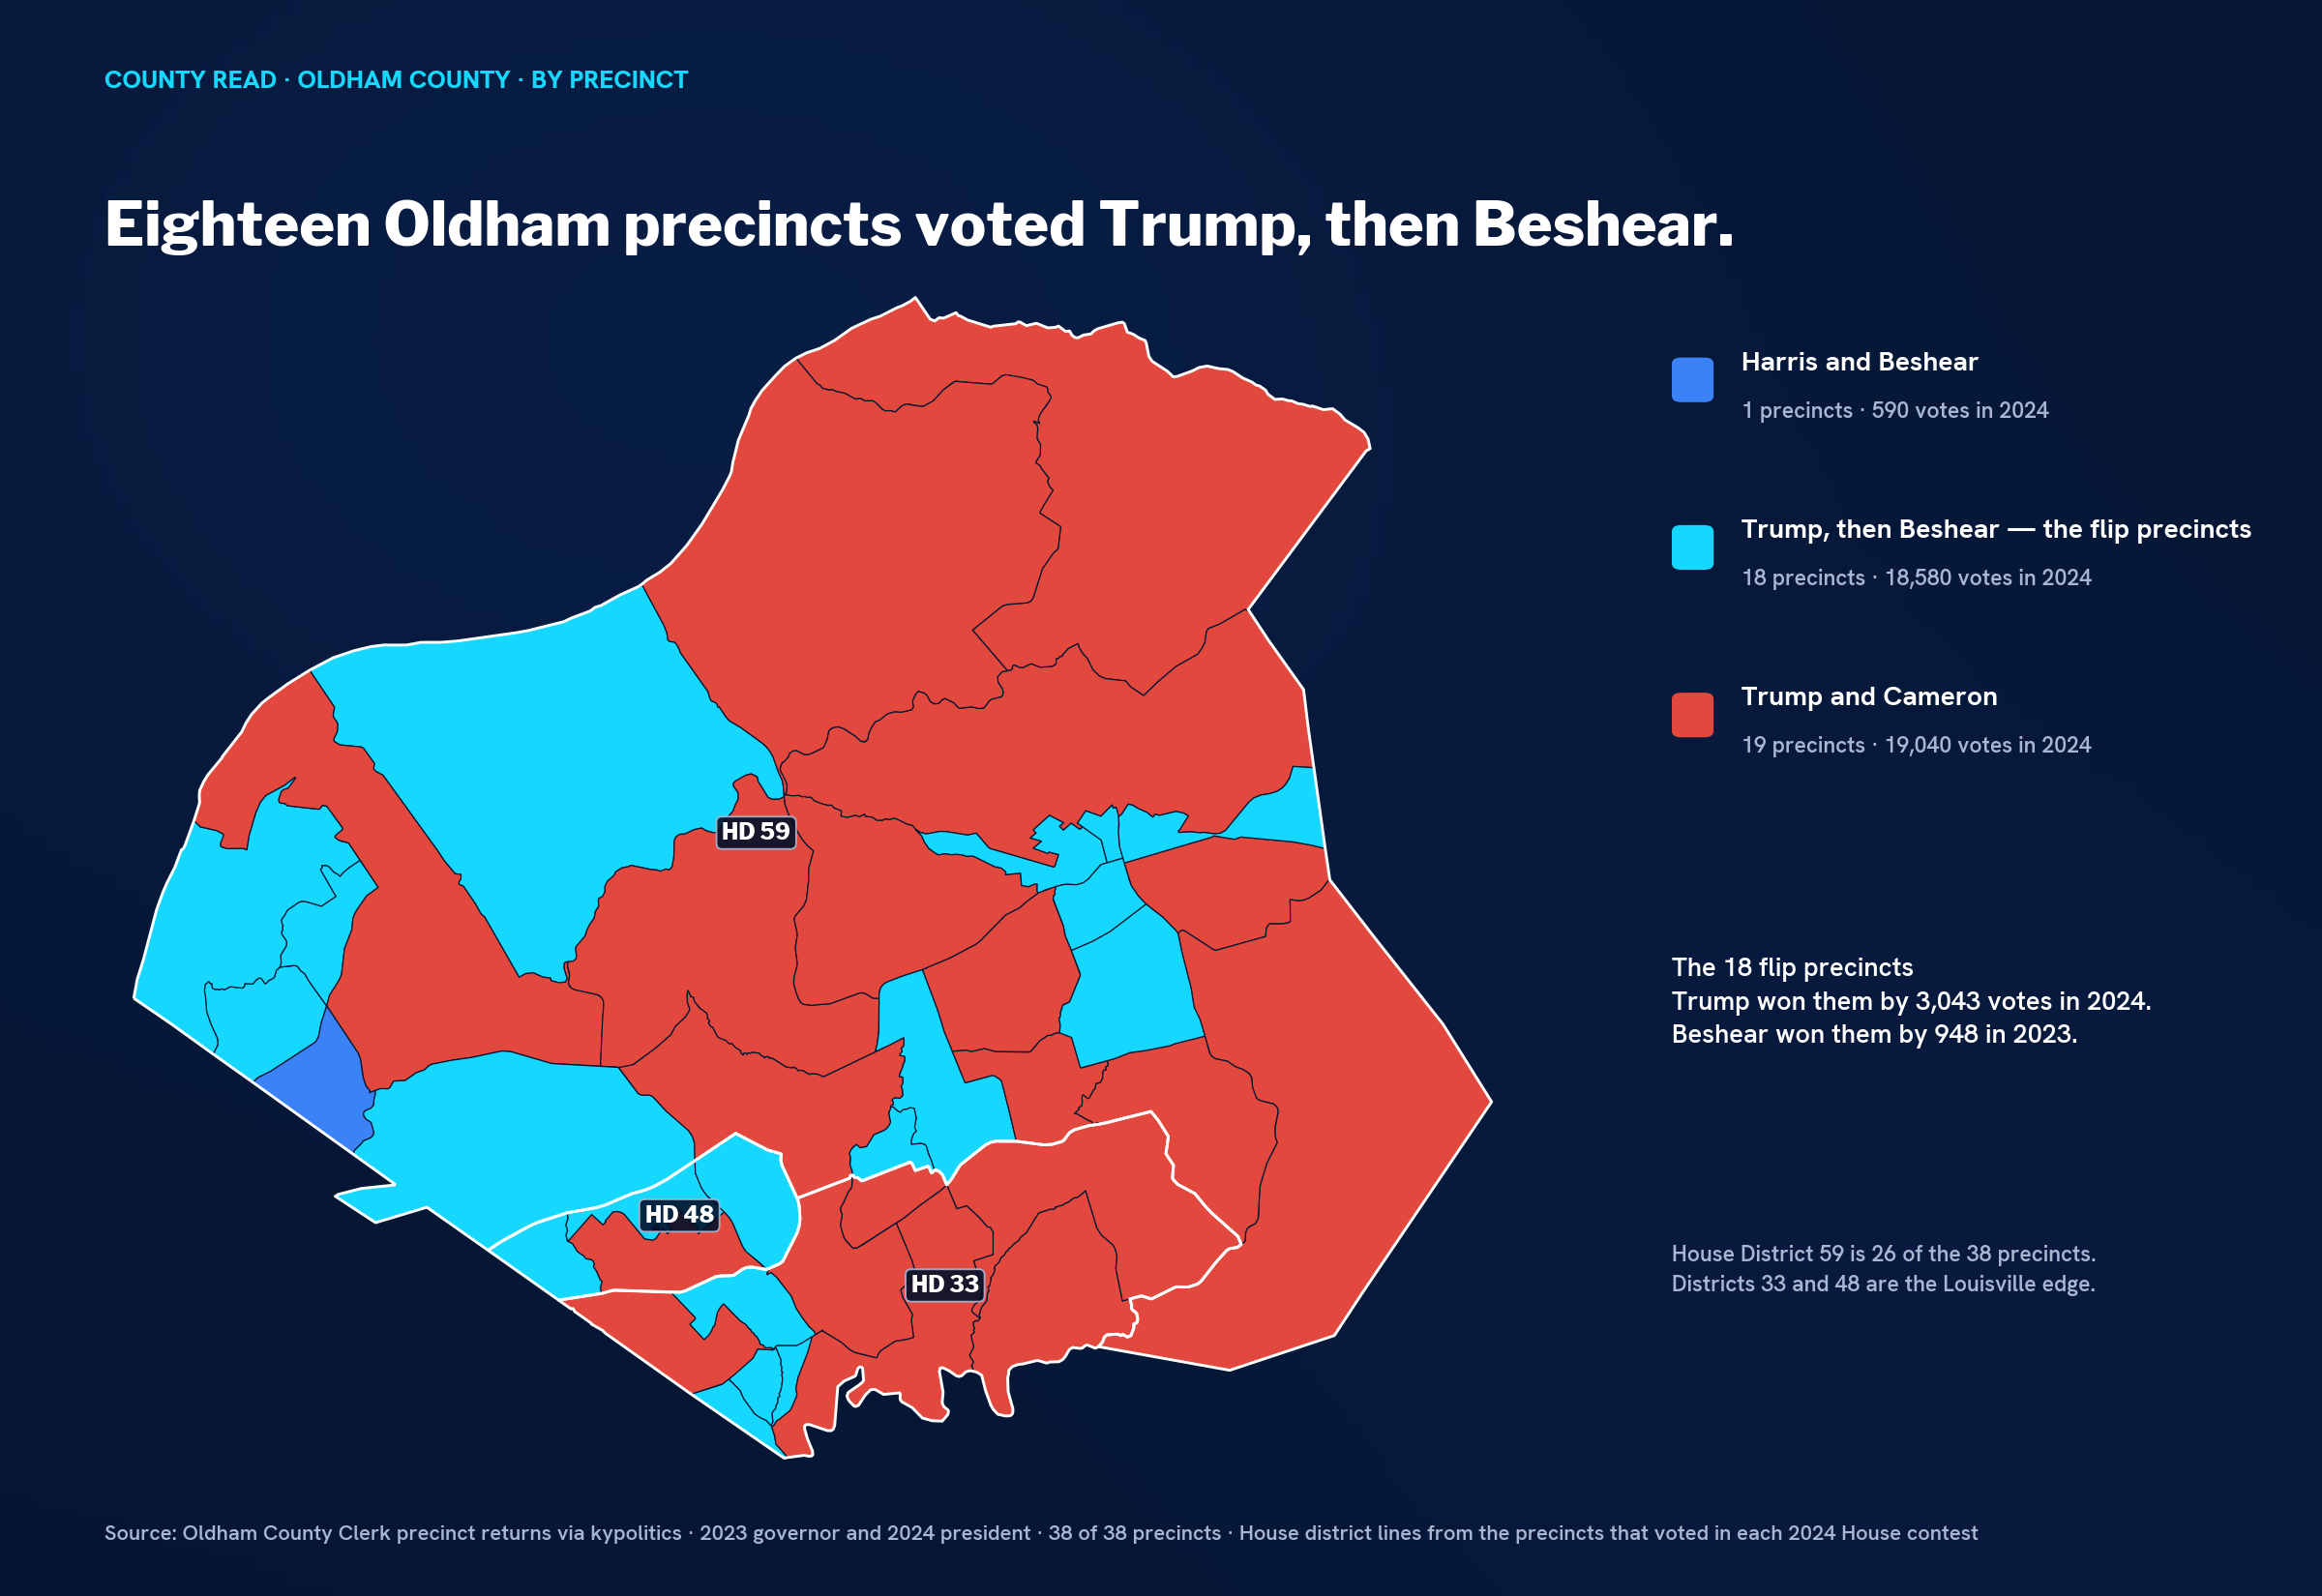
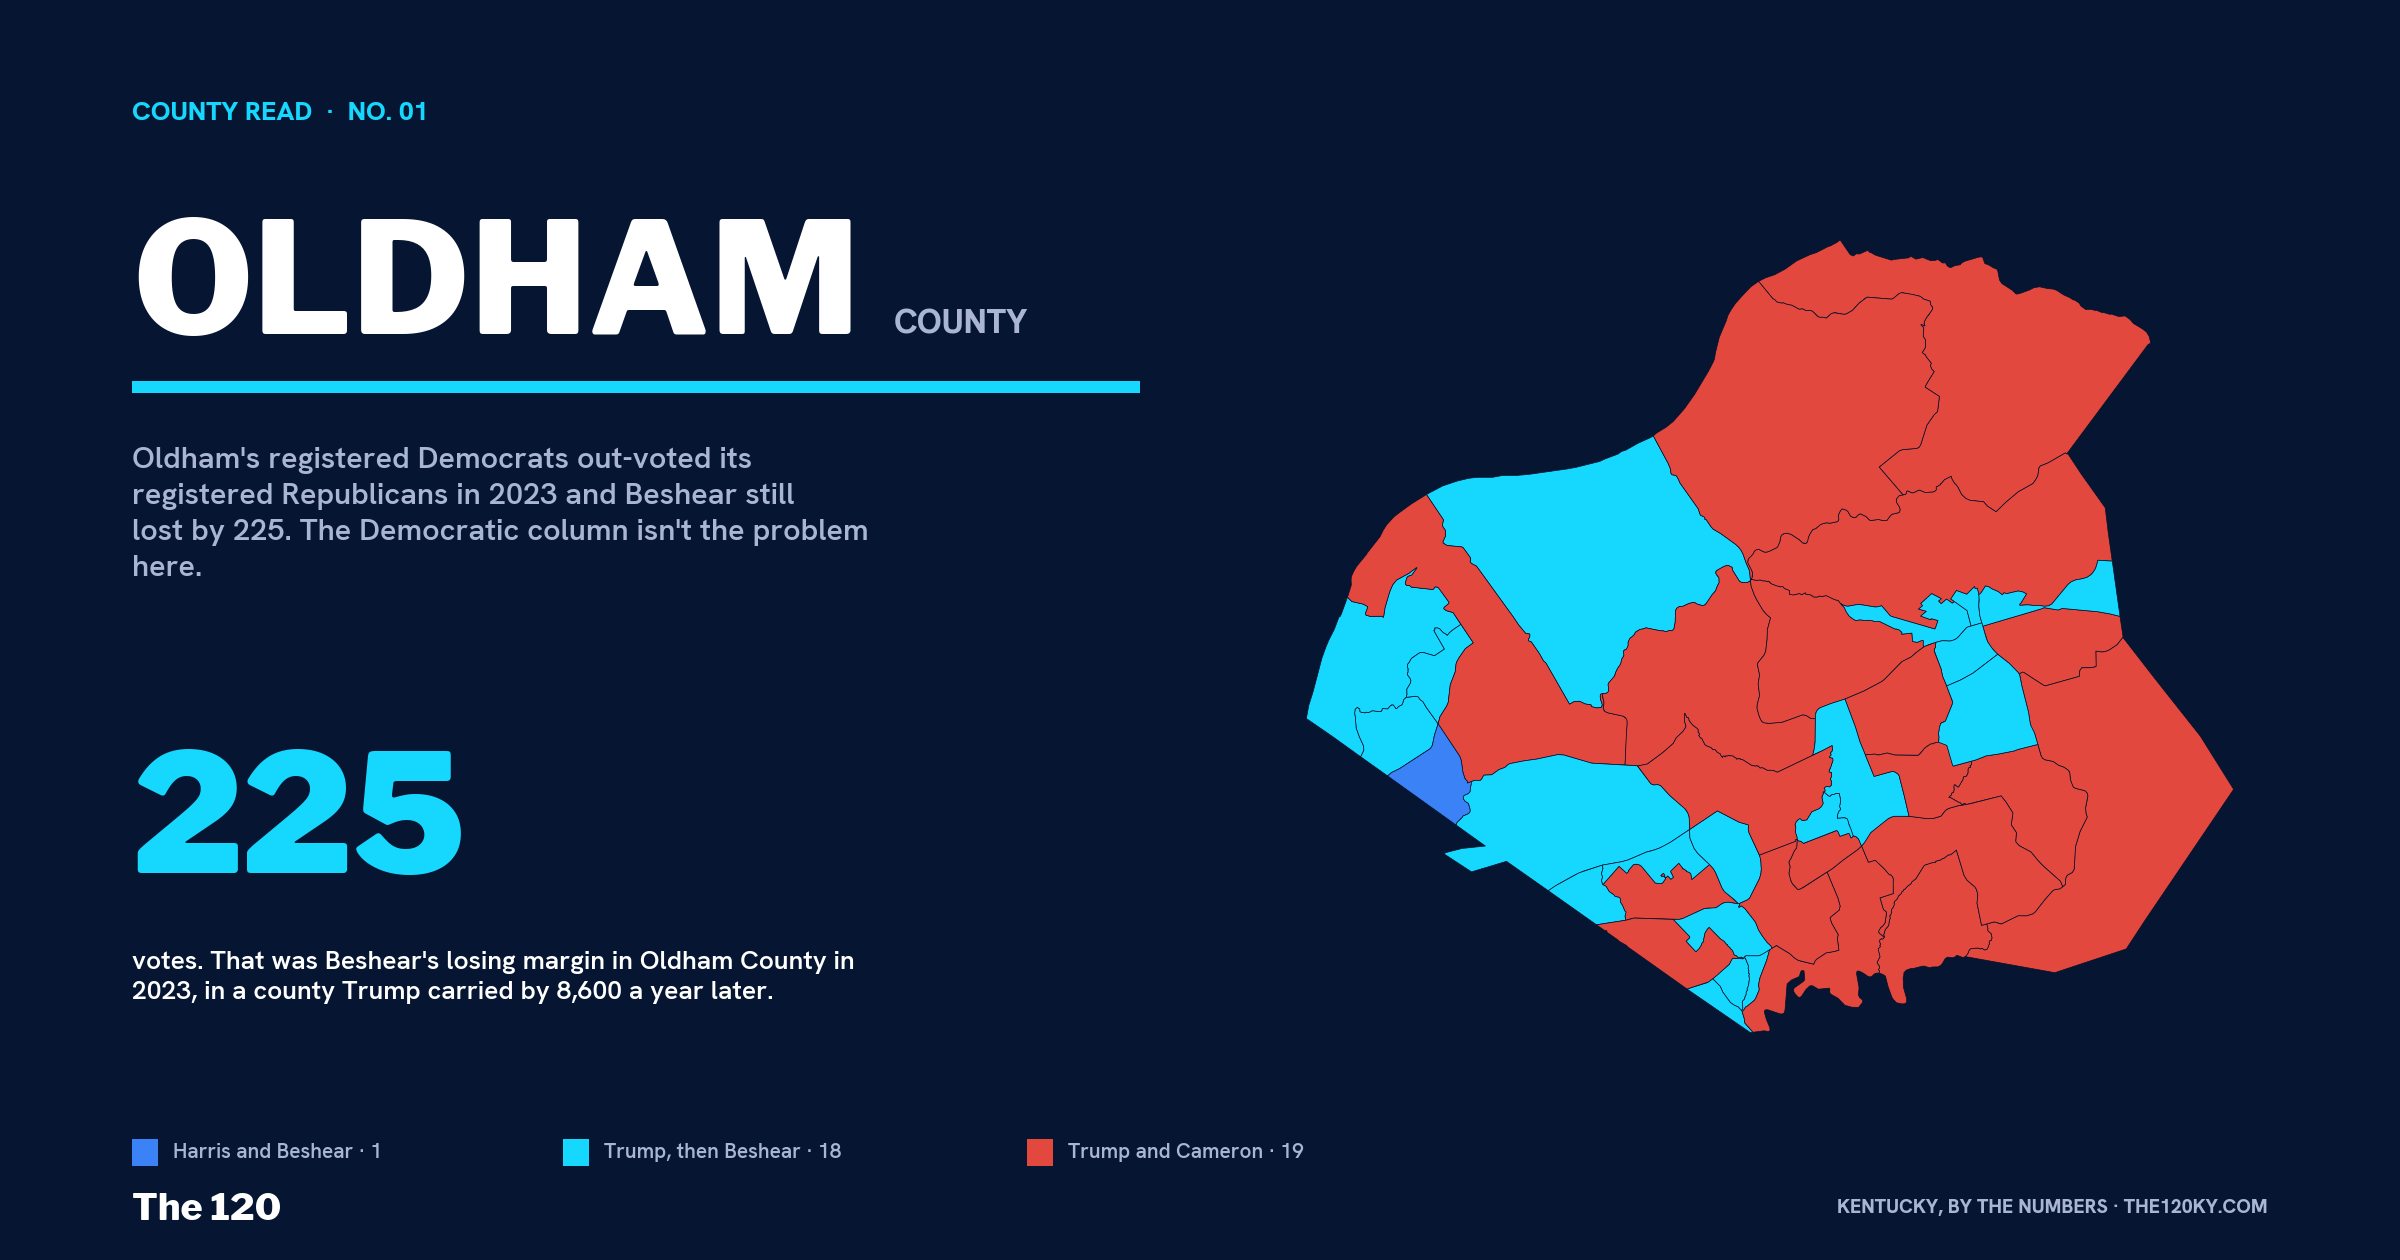
One precinct voted for Harris and for Beshear. Nineteen voted for Trump and for Cameron — 19,040 votes, Trump by 5,611, and that's the Republican floor. The other eighteen voted for Trump in 2024 and for Beshear in 2023: 18,580 votes, Trump by 3,043, Beshear by 948. Those eighteen are the county. They aren't one neighborhood — they run from the river precincts around Goshen through La Grange and Buckner to the Crestwood and Pewee Valley precincts on the Jefferson County edge. What they have in common is density: the flip precincts are the town precincts, a median of 1.3 square miles with three times the votes per square mile of the nineteen that held for Cameron, which are the countryside, a median of 4.3 square miles each. Oldham's towns moved. Its farms didn't. They're the eighteen I pointed at last week as Christian Furman's race for the Senate seat. They're also the eighteen that decide whether this county's House seats ever become races.
What's on the ballot, and who's paying. Every legislative seat on Oldham's November ballot has a Democrat on it. That hasn't happened in the years I have precinct data for.
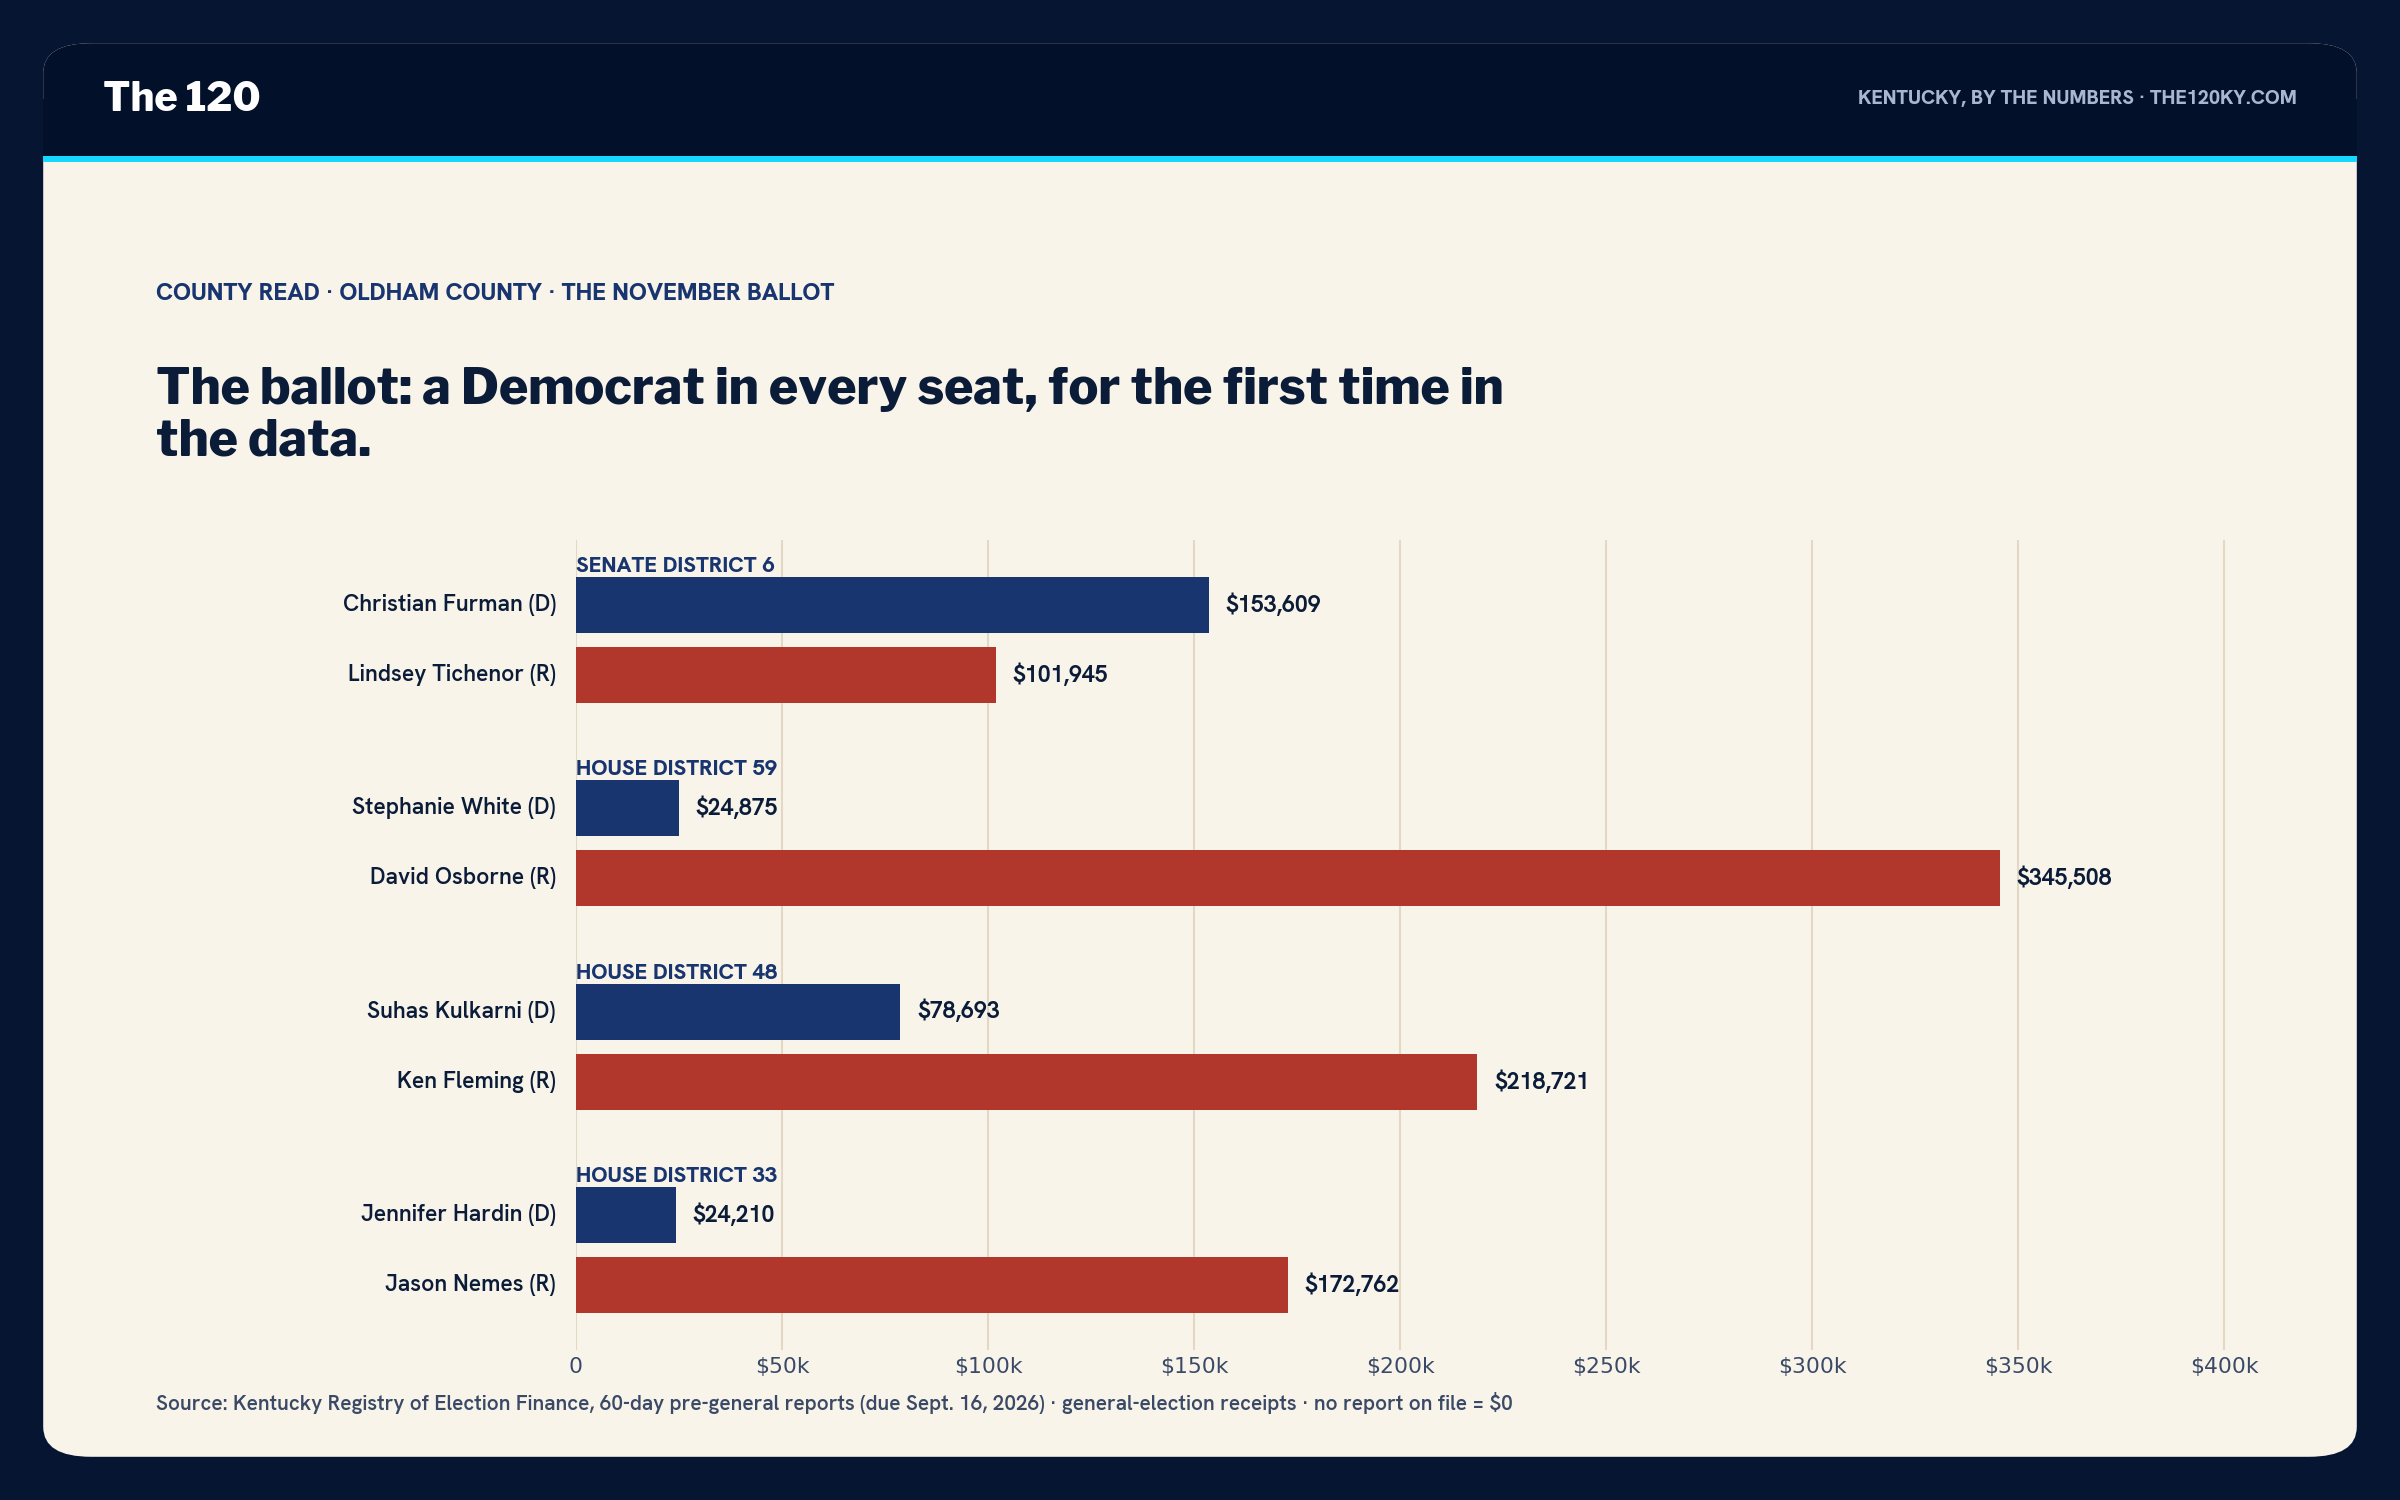
Senate District 6 is the race I wrote about last week: Dr. Christian Furman against Lindsey Tichenor, Furman up $153,609 to $101,945, the whole thing living in those eighteen precincts. House District 59 is the one that surprised me. It's David Osborne's seat — the Speaker of the House — and it covers 26 of Oldham's 38 precincts. In four of the last five elections — 2016, 2020, 2022 and 2024 — the Democratic line under Osborne's name was blank; the one Democrat who tried, in 2018, took 36%. This year Stephanie White filed, and she's reported $24,875 against the Speaker's $345,508. That's fourteen to one, and it's not a race, but it's only the second time in a decade that a Democrat in the middle of Oldham County has had a name to vote for below the Senate line, and the eighteen flip precincts are mostly in the 59th. House District 48 — Ken Fleming's seat, four Oldham precincts and the Middletown side of Jefferson — has Suhas Kulkarni at $78,693 against Fleming's $218,721, which is the best-funded Democratic challenge on this ballot after Furman. House District 33, Jason Nemes's seat, has Jennifer Hardin at $24,210 against $172,762.
The money says the same thing in three of the four seats: the Republicans are sitting on it. Osborne has spent $16,600 of $345,000. Fleming has spent $75,000, which is real. Nemes, $10,500. Furman is the only challenger on this ballot who is funded like a challenger, and Kulkarni is the only other one who's within striking distance of being one.
The read. Oldham is the cleanest example in Kentucky of a county whose electorate has moved and whose registration hasn't caught up — the mirror image of Breathitt and Pike. It is not a Democratic county and it's not becoming one; a 55–31 Republican registration doesn't flip because Beshear ran well once. What it is, is a county where the Republican margin on a federal ballot fell from 37 to 22 in twelve years, where the Democrats who are registered show up at Republican rates, and where a Beshear-shaped Democrat in a state-level race gets to within 225 votes. That's a county with one competitive seat this year, one that could become competitive if the money ever showed up, and eighteen precincts that decide both.
What I'm watching in November: those eighteen, the way I said last week, and one more number — the no-party turnout rate. It was 33% in the last midterm. If it comes in over 40% in Oldham, the county's electorate is changing faster than the paper says, and County Read No. 1 is going to need a sequel.
Next Friday: Jefferson. The biggest one.
Disclosure: I work in Kentucky Democratic politics and consult campaigns in this state. I have no client relationship with any candidate named above. I read this county the same way whether or not it's good news for my side — that's the job. Registration is the Secretary of State's county reports, 2010 through August 2026. Results and turnout by column are the county clerk's certified returns and the Secretary of State's post-election turnout reports via kypolitics; all 38 Oldham precincts carry 2023 and 2024 results. House district lines are drawn from the precincts that voted in each 2024 House contest. Money is from the Kentucky Registry of Election Finance's 60-day pre-general reports.