
County Read No. 20 · Shelby County
Shelby County, where the Democrat in the 58th has raised nine dollars for every ten
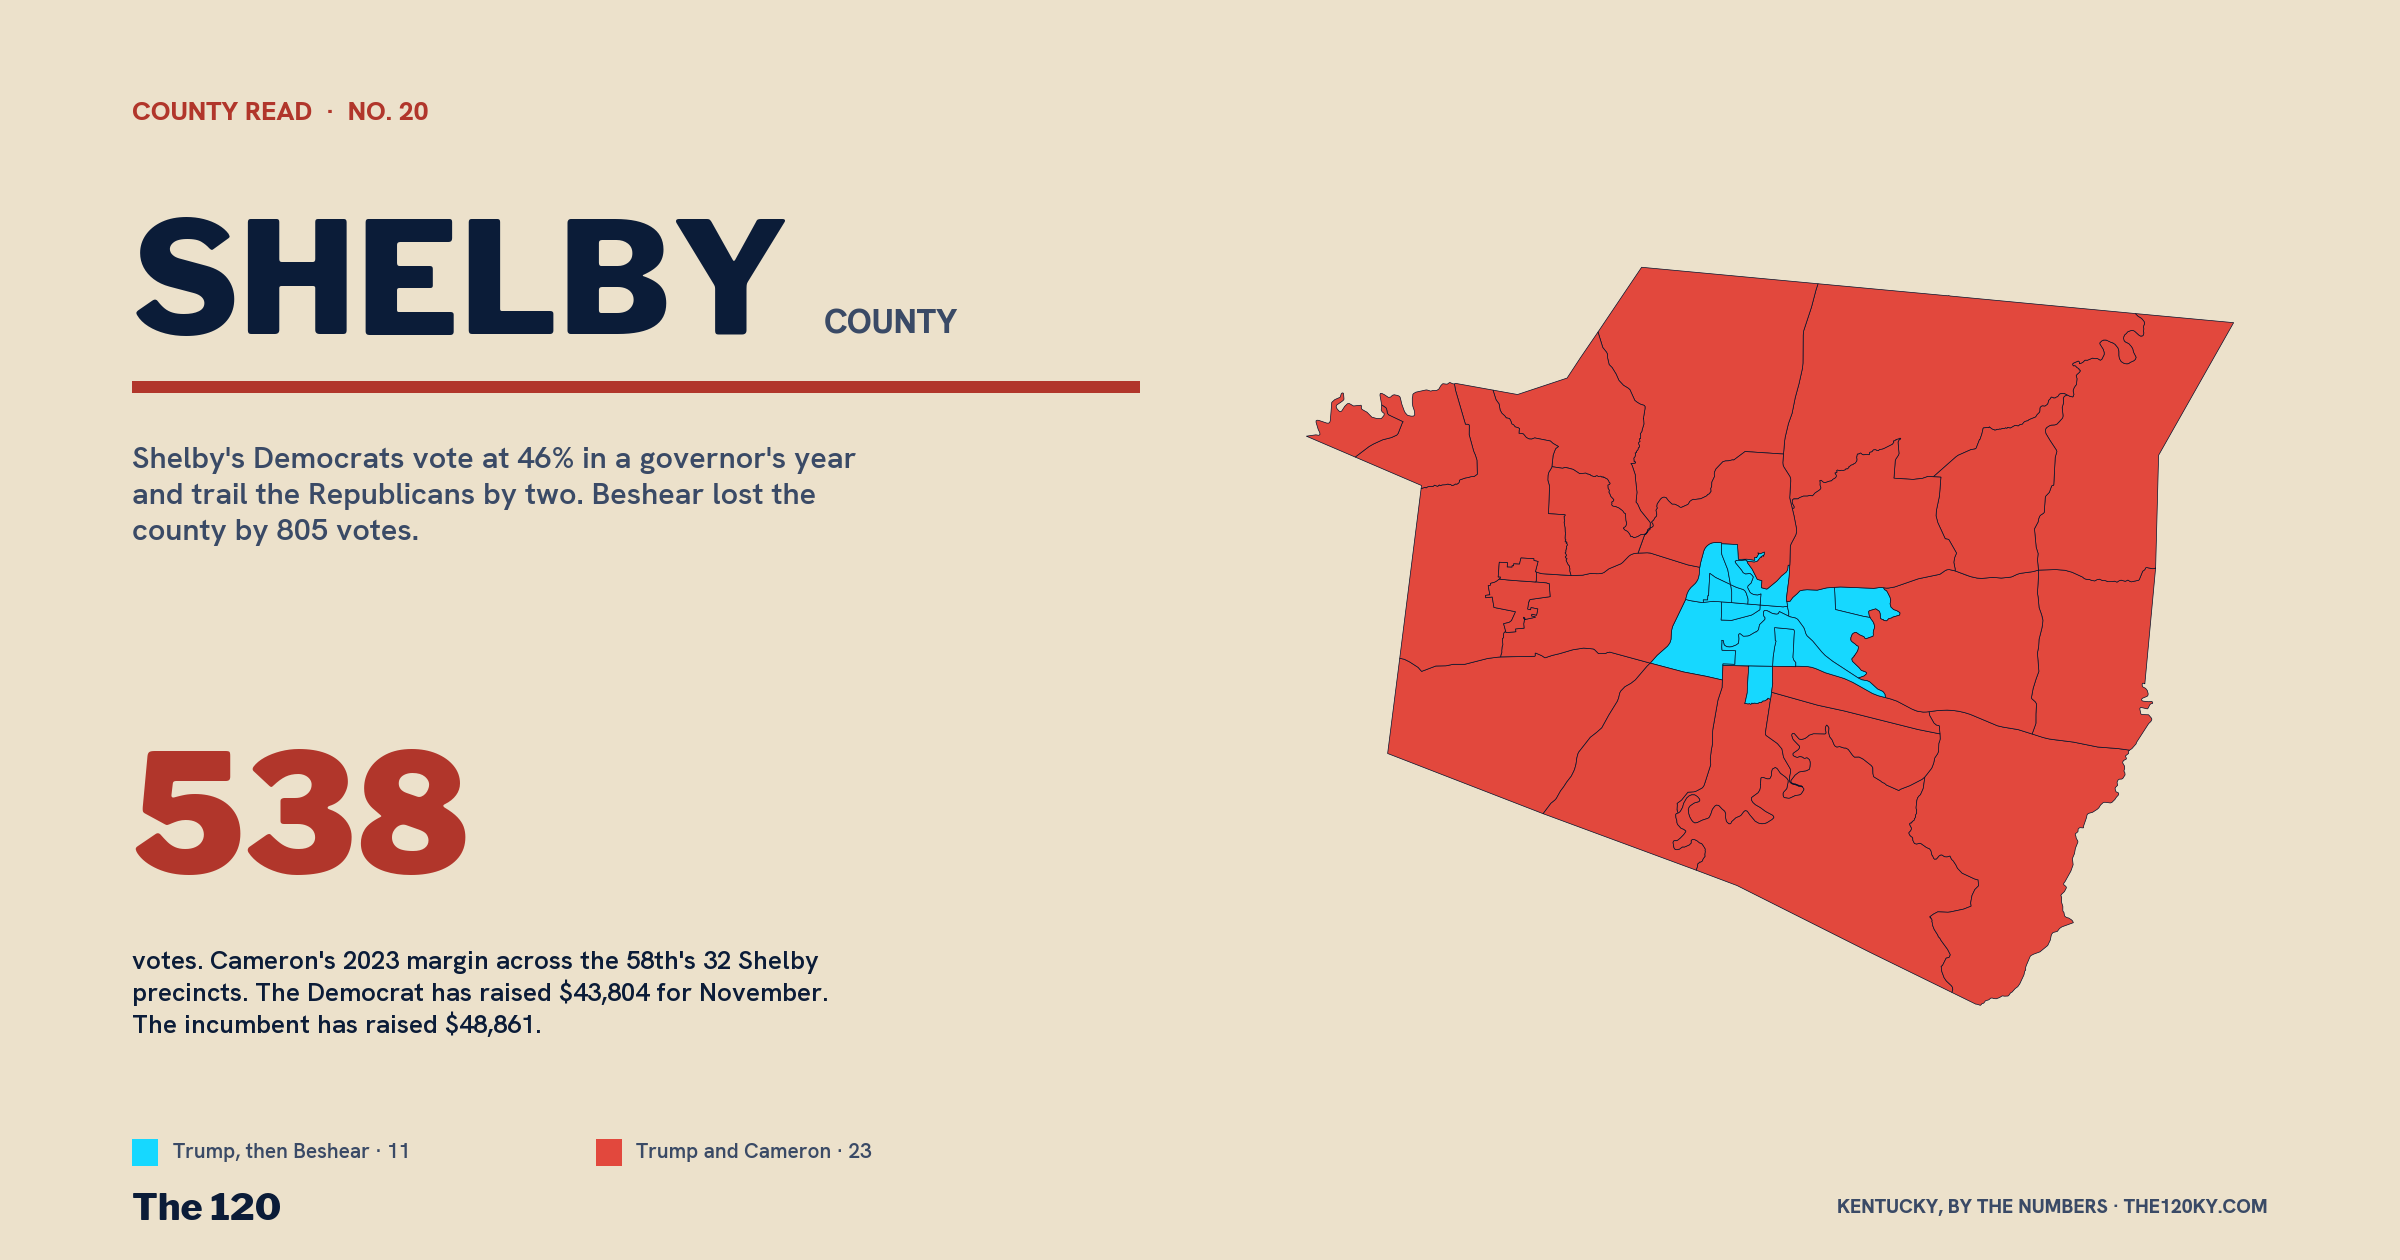
Shelby County's voter rolls grew by nearly half since 2010. It swings 30 points between a Trump ballot and a Beshear ballot and holds 32 of its 34 precincts in one House seat, the 58th, which had no Democrat in 2024, where Cameron's margin was 538 votes, and where the Democrat has raised $43,804 to the incumbent's $48,861. Twentieth of twenty.
SHELBYVILLE — Twentieth of twenty. Same five questions, one last time: the paper, the ballots, the turnout, the map, the money. Shelby County is the smallest county on the list and it ends the series on the one number I've been looking for since Jefferson.
What the paper says. Shelby County has 38,804 registered voters on the August file: 13,813 Democrats, 20,582 Republicans, 4,409 in neither column. That's 35.6% Democratic, 53.0% Republican, 11.4% no-party. In 2010 it had 26,287 voters and was 55.0% Democratic, 38.3% Republican. It's grown by 48%, 12,500 voters, second only to Scott in the series, and the Republican column took 10,500 of them; the Democratic column lost 660. Louisville's eastern exurb, on the Scott and Jessamine model: new arrivals, not switchers. And it's still growing: since Election Day 2024 the file added 366 names net through the purge: Democrats down 519, Republicans up 594, no-party up 291. Kenton, McCracken and Shelby are the three counties in the twenty that grew through the cleanup.
What the ballots say. A 30-point swing, and Beshear came within 805 votes.
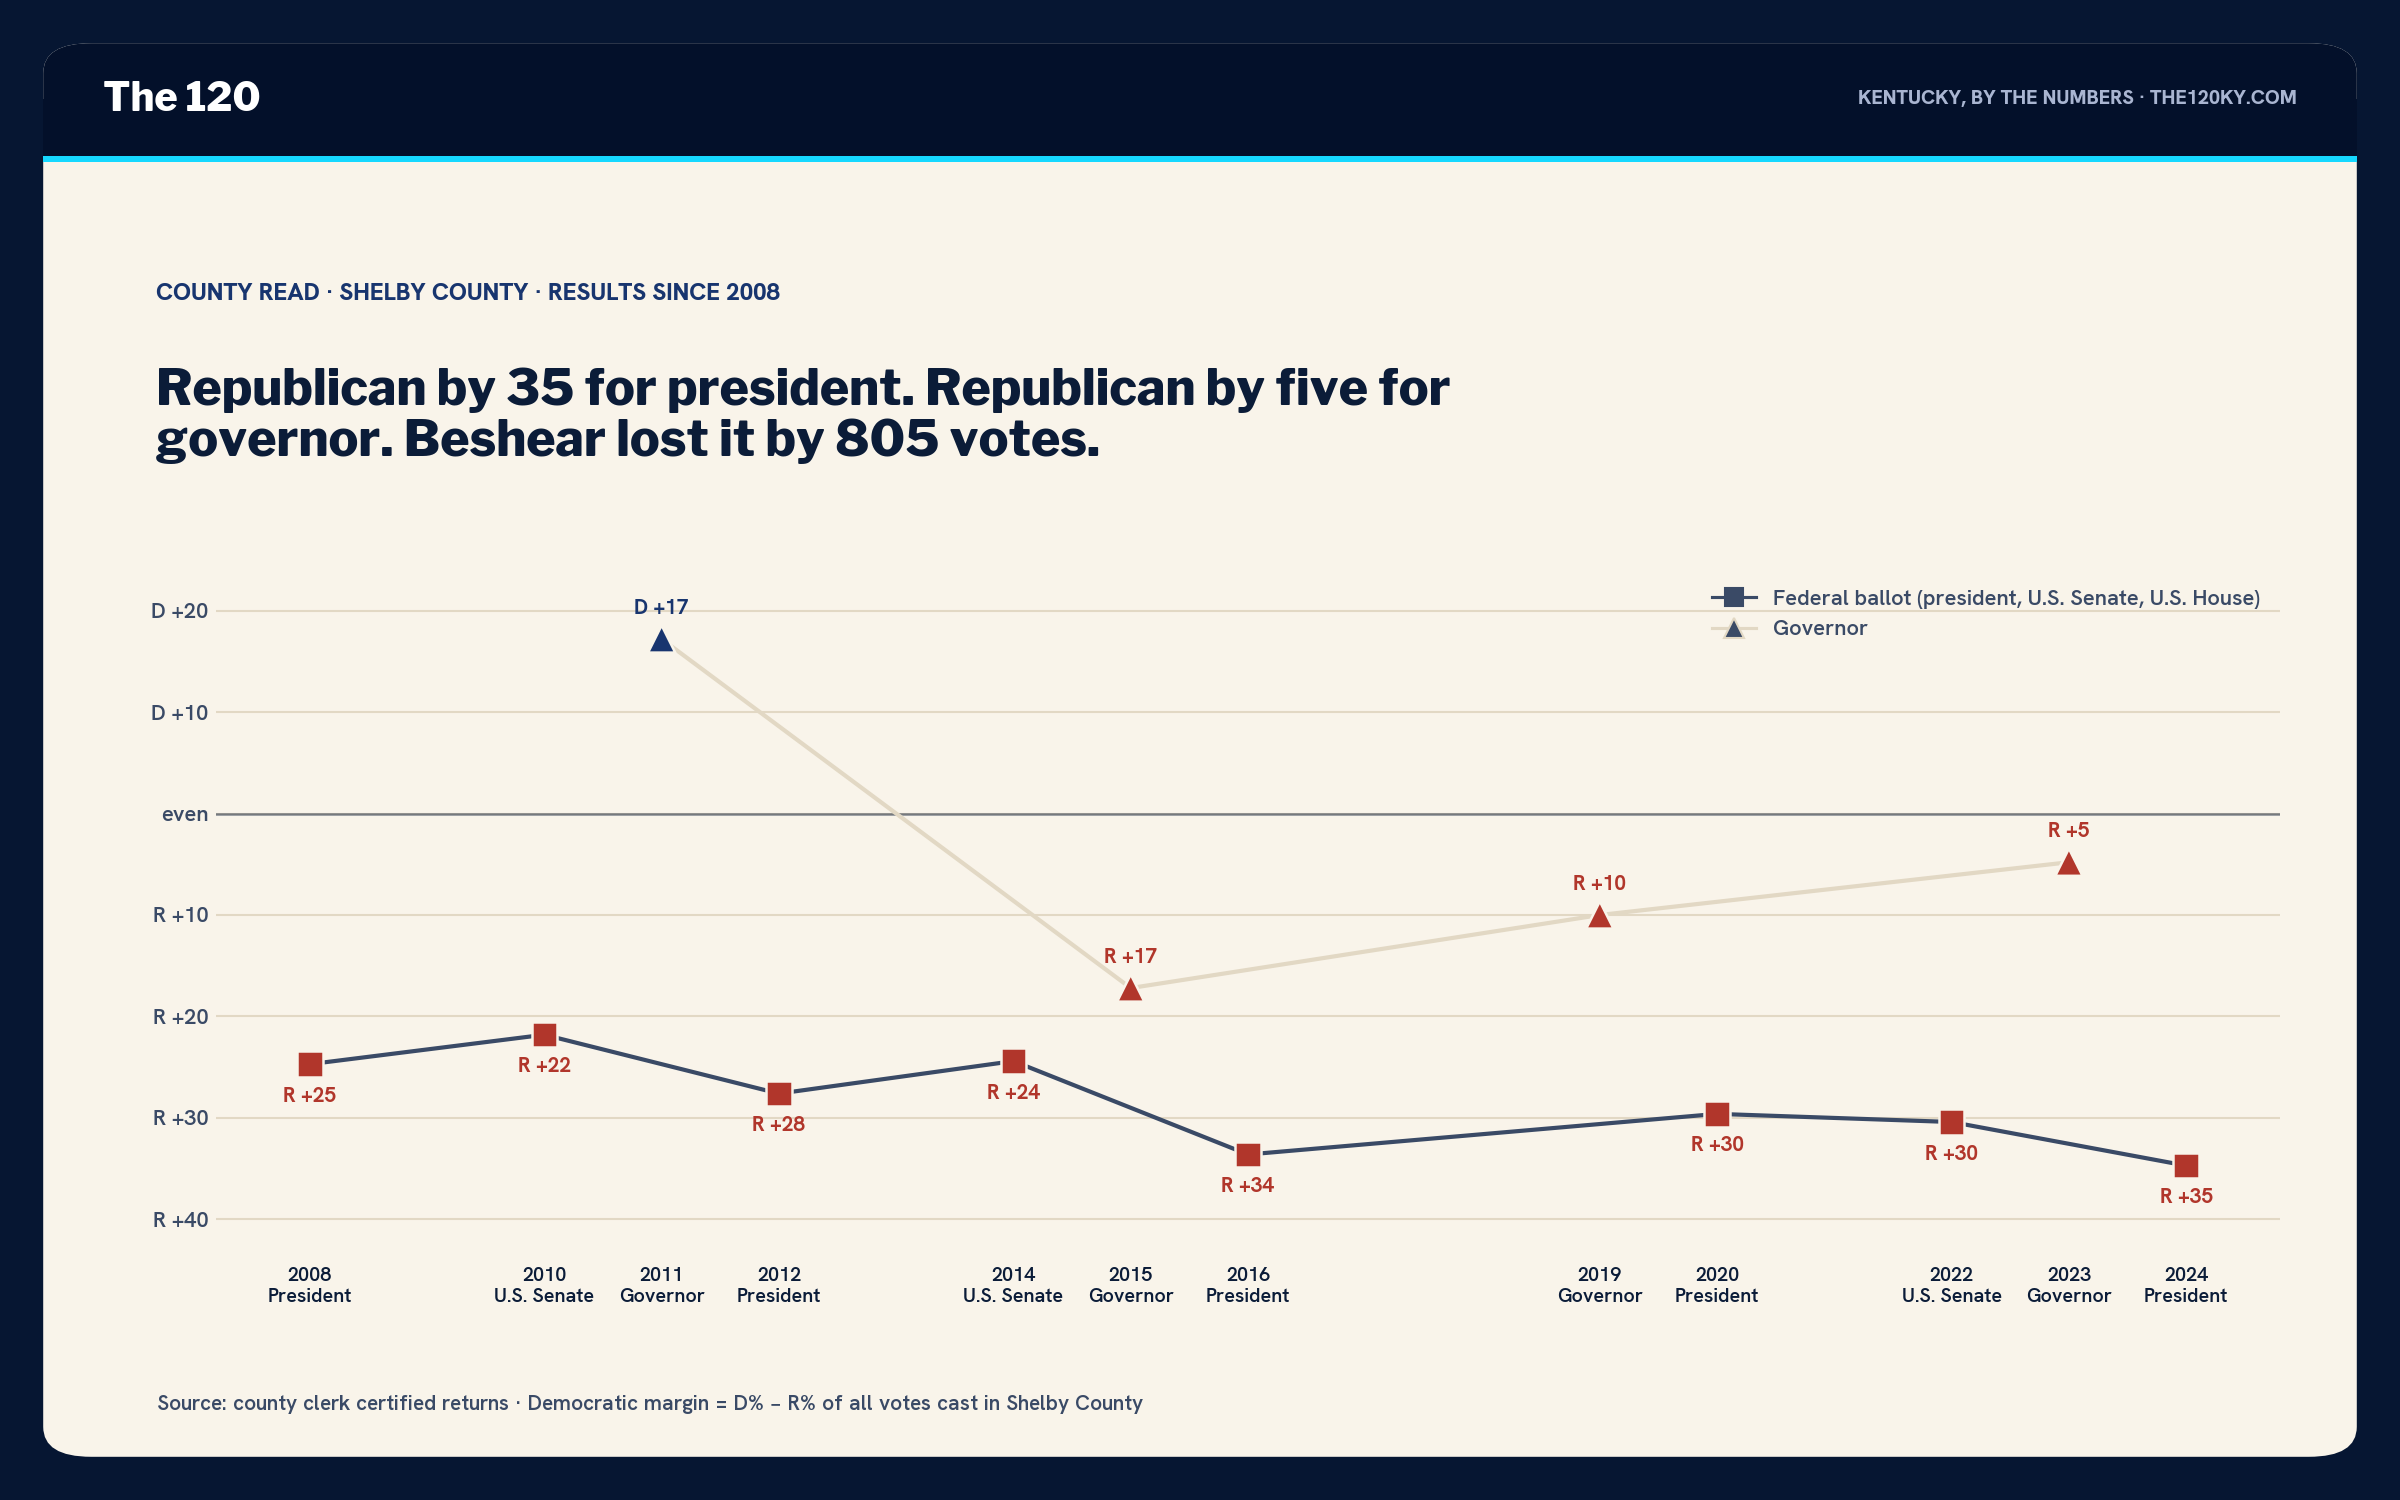
Trump carried Shelby County by 35 in 2024, 16,356 to 7,822. Cameron carried it by 4.8 in 2023, 8,751 to 7,946, 805 votes. That's a 29.9-point swing between consecutive Novembers, in the same band as Jessamine, McCracken, Hardin and Warren. Beshear went from minus ten in 2019 to minus five in 2023, and got 47.6% of a county that's 53% Republican on paper. His 7,946 votes are more than Harris's 7,822, one of at least seven counties in the series where the Democratic governor's vote in an off-year beat the Democratic presidential vote in a presidential one. Bullitt, Pulaski, Laurel, Pike, Scott, Franklin, Shelby: that's the list of counties where Beshear's margin isn't Democrats coming home; it's Republicans and no-party voters splitting a ticket a year apart.
Who's turning out. Everybody votes here, and the columns are close.
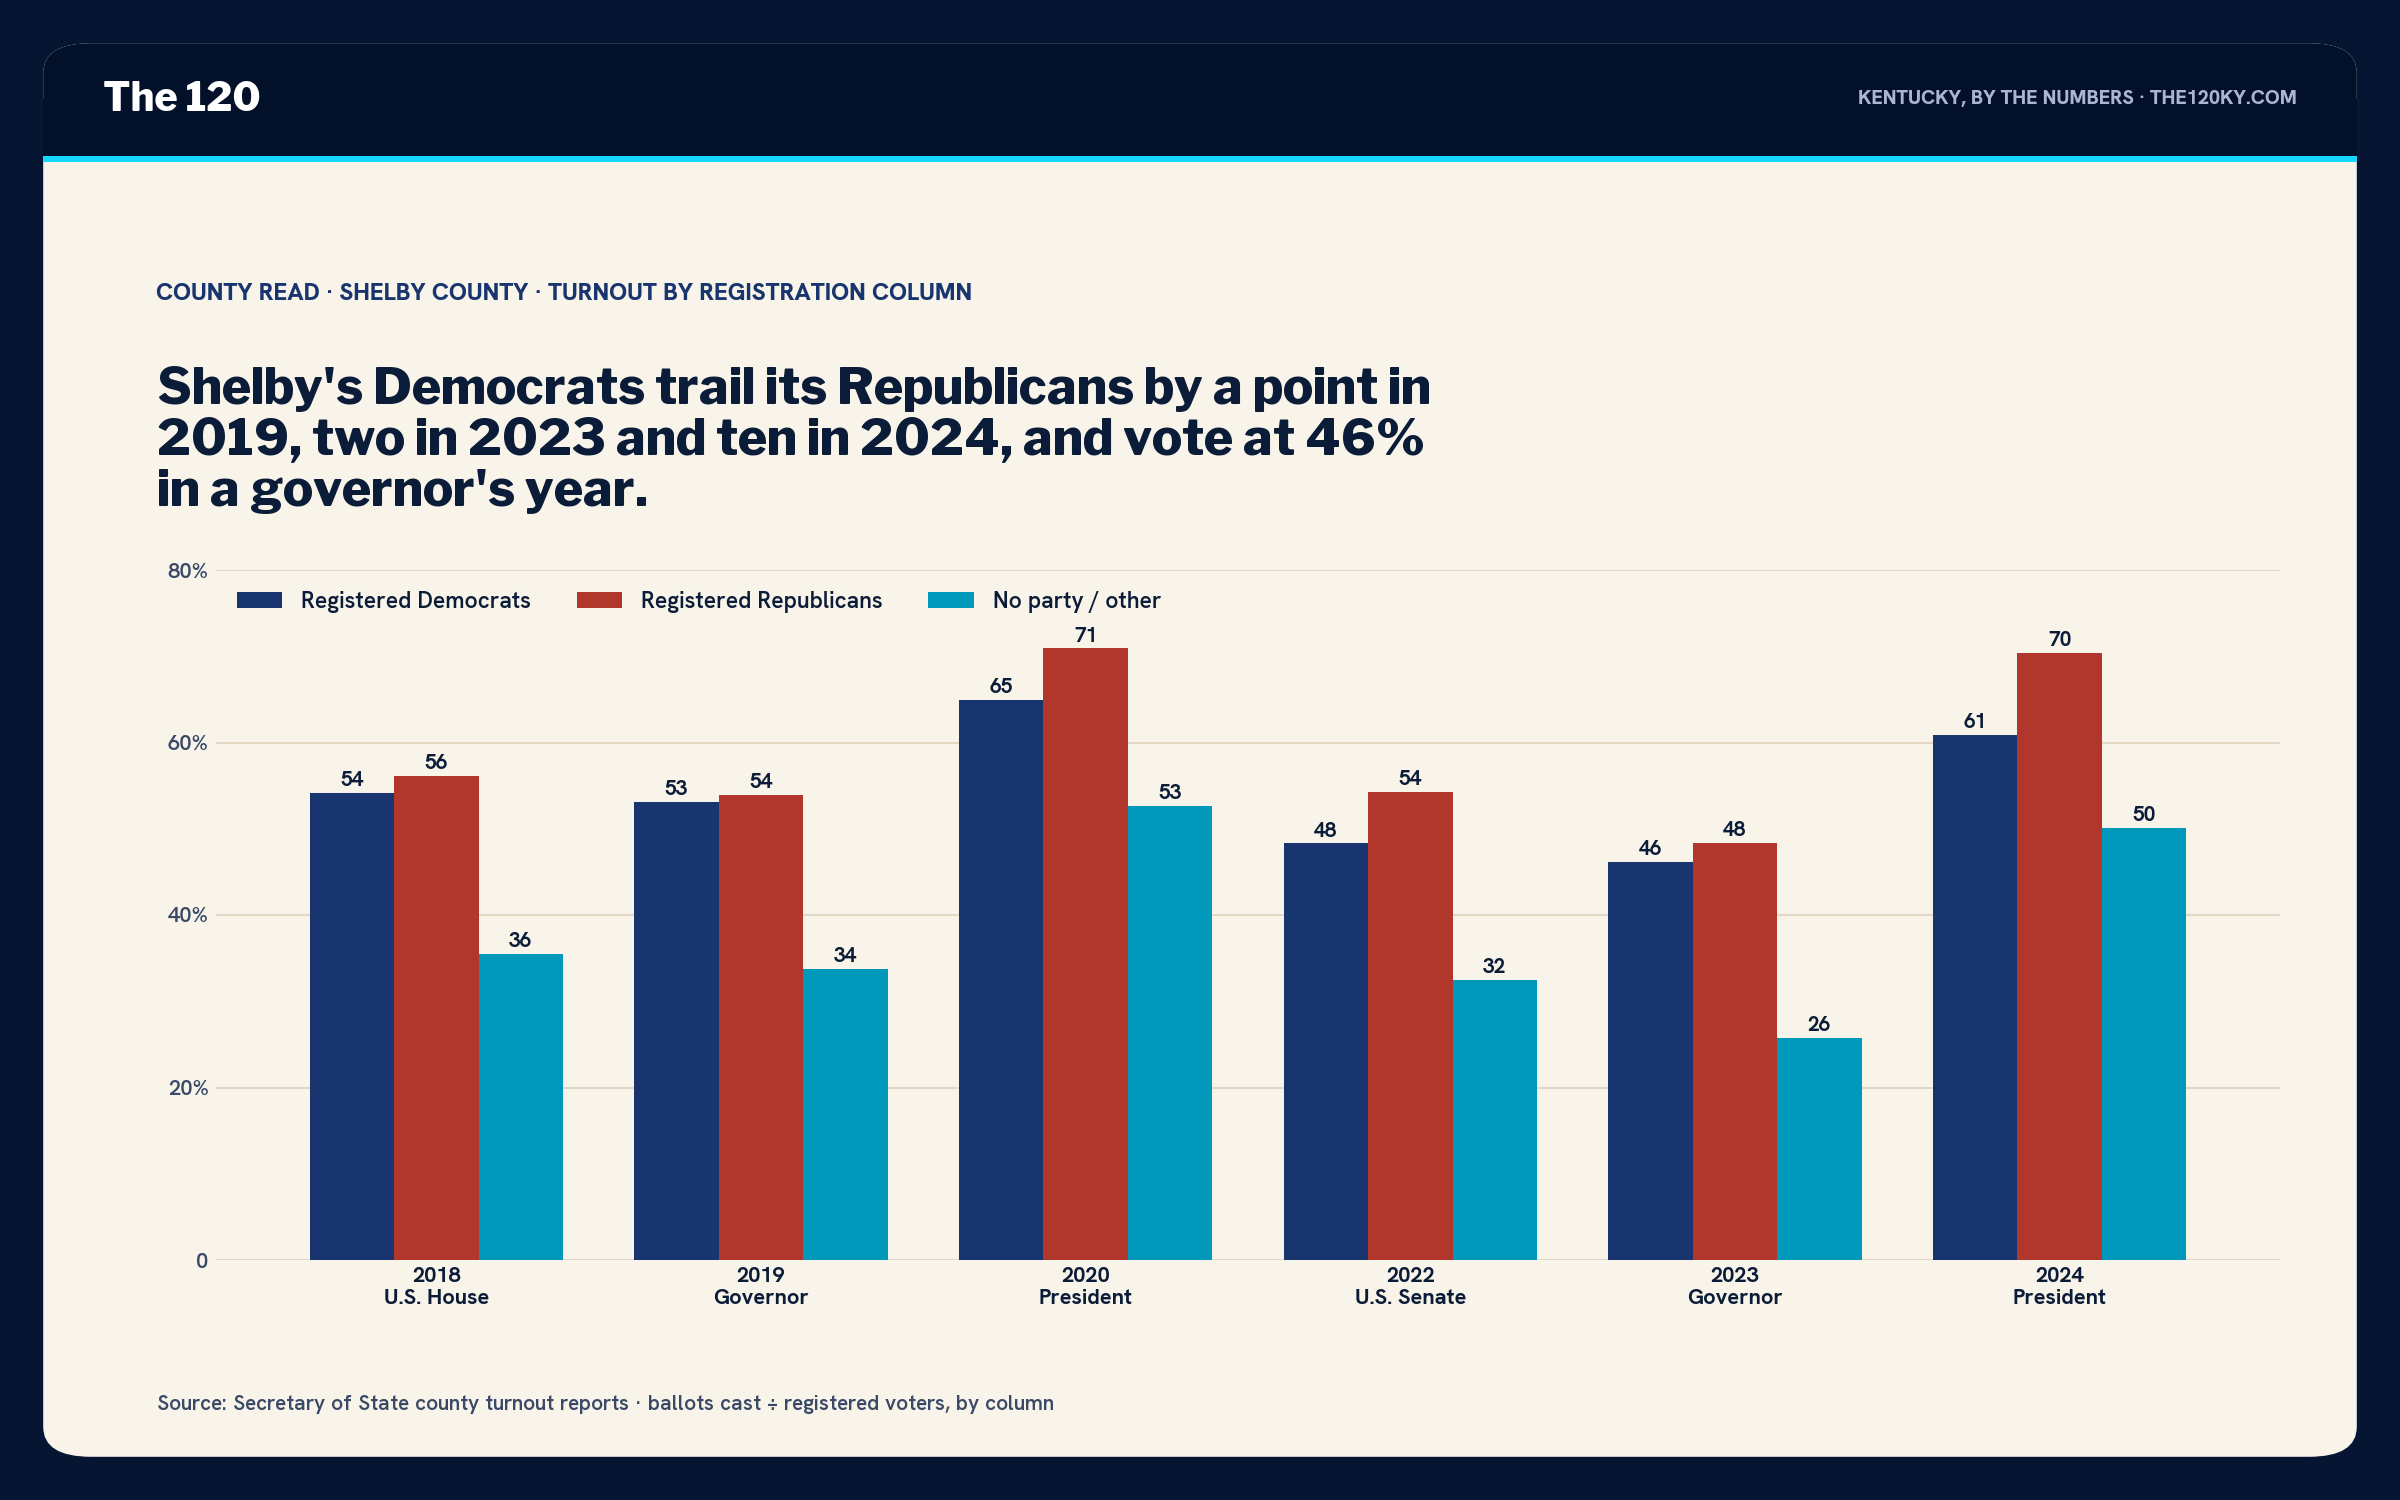
In 2019, 53.1% of Shelby's registered Democrats voted and 53.9% of its Republicans did. In 2023, 46.2 to 48.4. Those are high numbers for a governor's year (the Democratic column's 46.2% in 2023 is the highest in the series outside Louisville, Lexington and Frankfort, ahead of Scott's 45.8), and the gap is two points. It opens to six in a midterm and nine and a half in a presidential year: 70.4% of Shelby's Republicans voted in 2024, which is Boone County territory. The no-party column, 4,409 voters, turned out at 32.5% in 2022 and 25.7% in 2023, among the better rates in the series.
Shelby's Democrats vote at 46% in a governor's year and trail the Republicans by two. Beshear lost the county by 805 votes. The seat that holds 32 of its 34 precincts had no Democrat in 2024 and has one now, with money.
Where it happens. All 34 precincts with both years, full coverage like Daviess and Pike, and the map does the Scott thing.
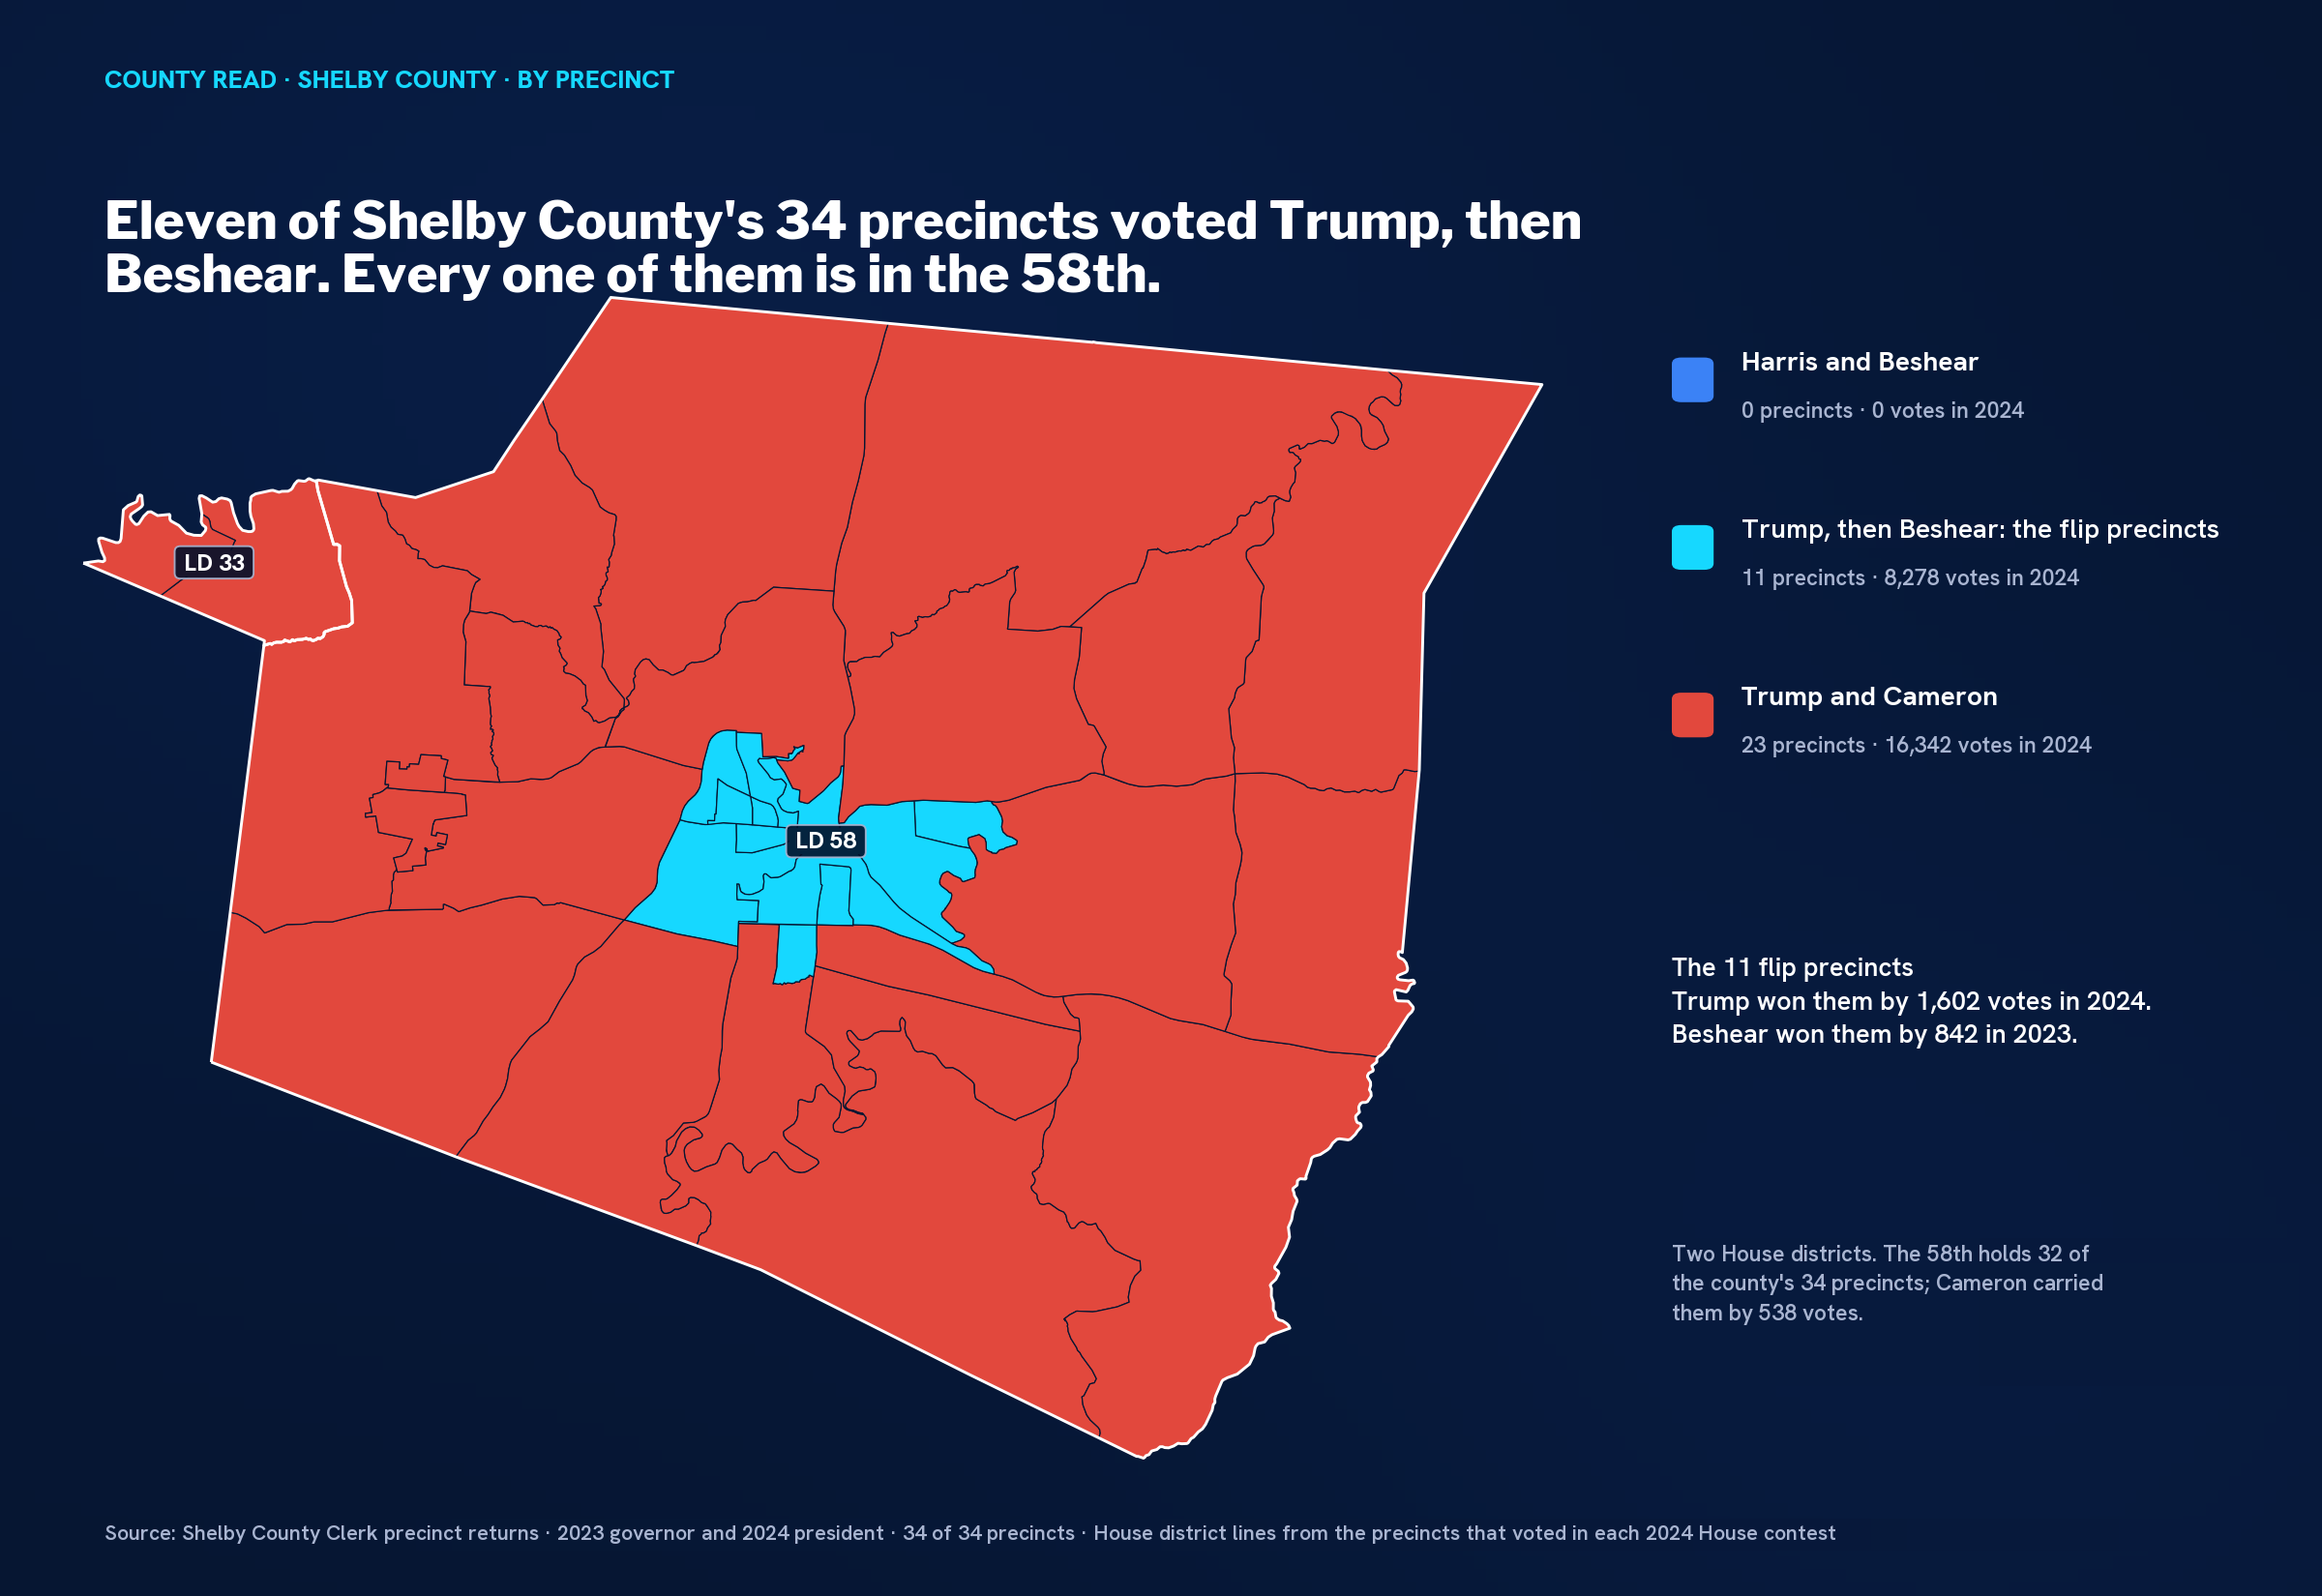
No precinct in Shelby County voted for Harris. Eleven voted for Trump and then for Beshear: 8,278 votes, Trump by 1,602, Beshear by 842. Twenty-three voted for Trump and for Cameron: 16,342 votes, Trump by 6,932, Cameron by 1,647. Beshear lost the county by 805: he won the eleven cyan precincts by 842 and lost the 23 red ones by 1,647. Shelbyville is the cyan; the rest of the county is the red; and the cyan is a third of the vote.
All eleven flip precincts are in the 58th, which holds 32 of the county's 34. Across those 32, Trump won by 7,926 and Cameron won by 538. The 33rd's two Shelby precincts went Trump +608, Cameron +267.
What's on the ballot, and who's paying. Two House districts touch Shelby County; its Senate seat isn't up this year. Both are contested. One of them is the race I've been waiting for.
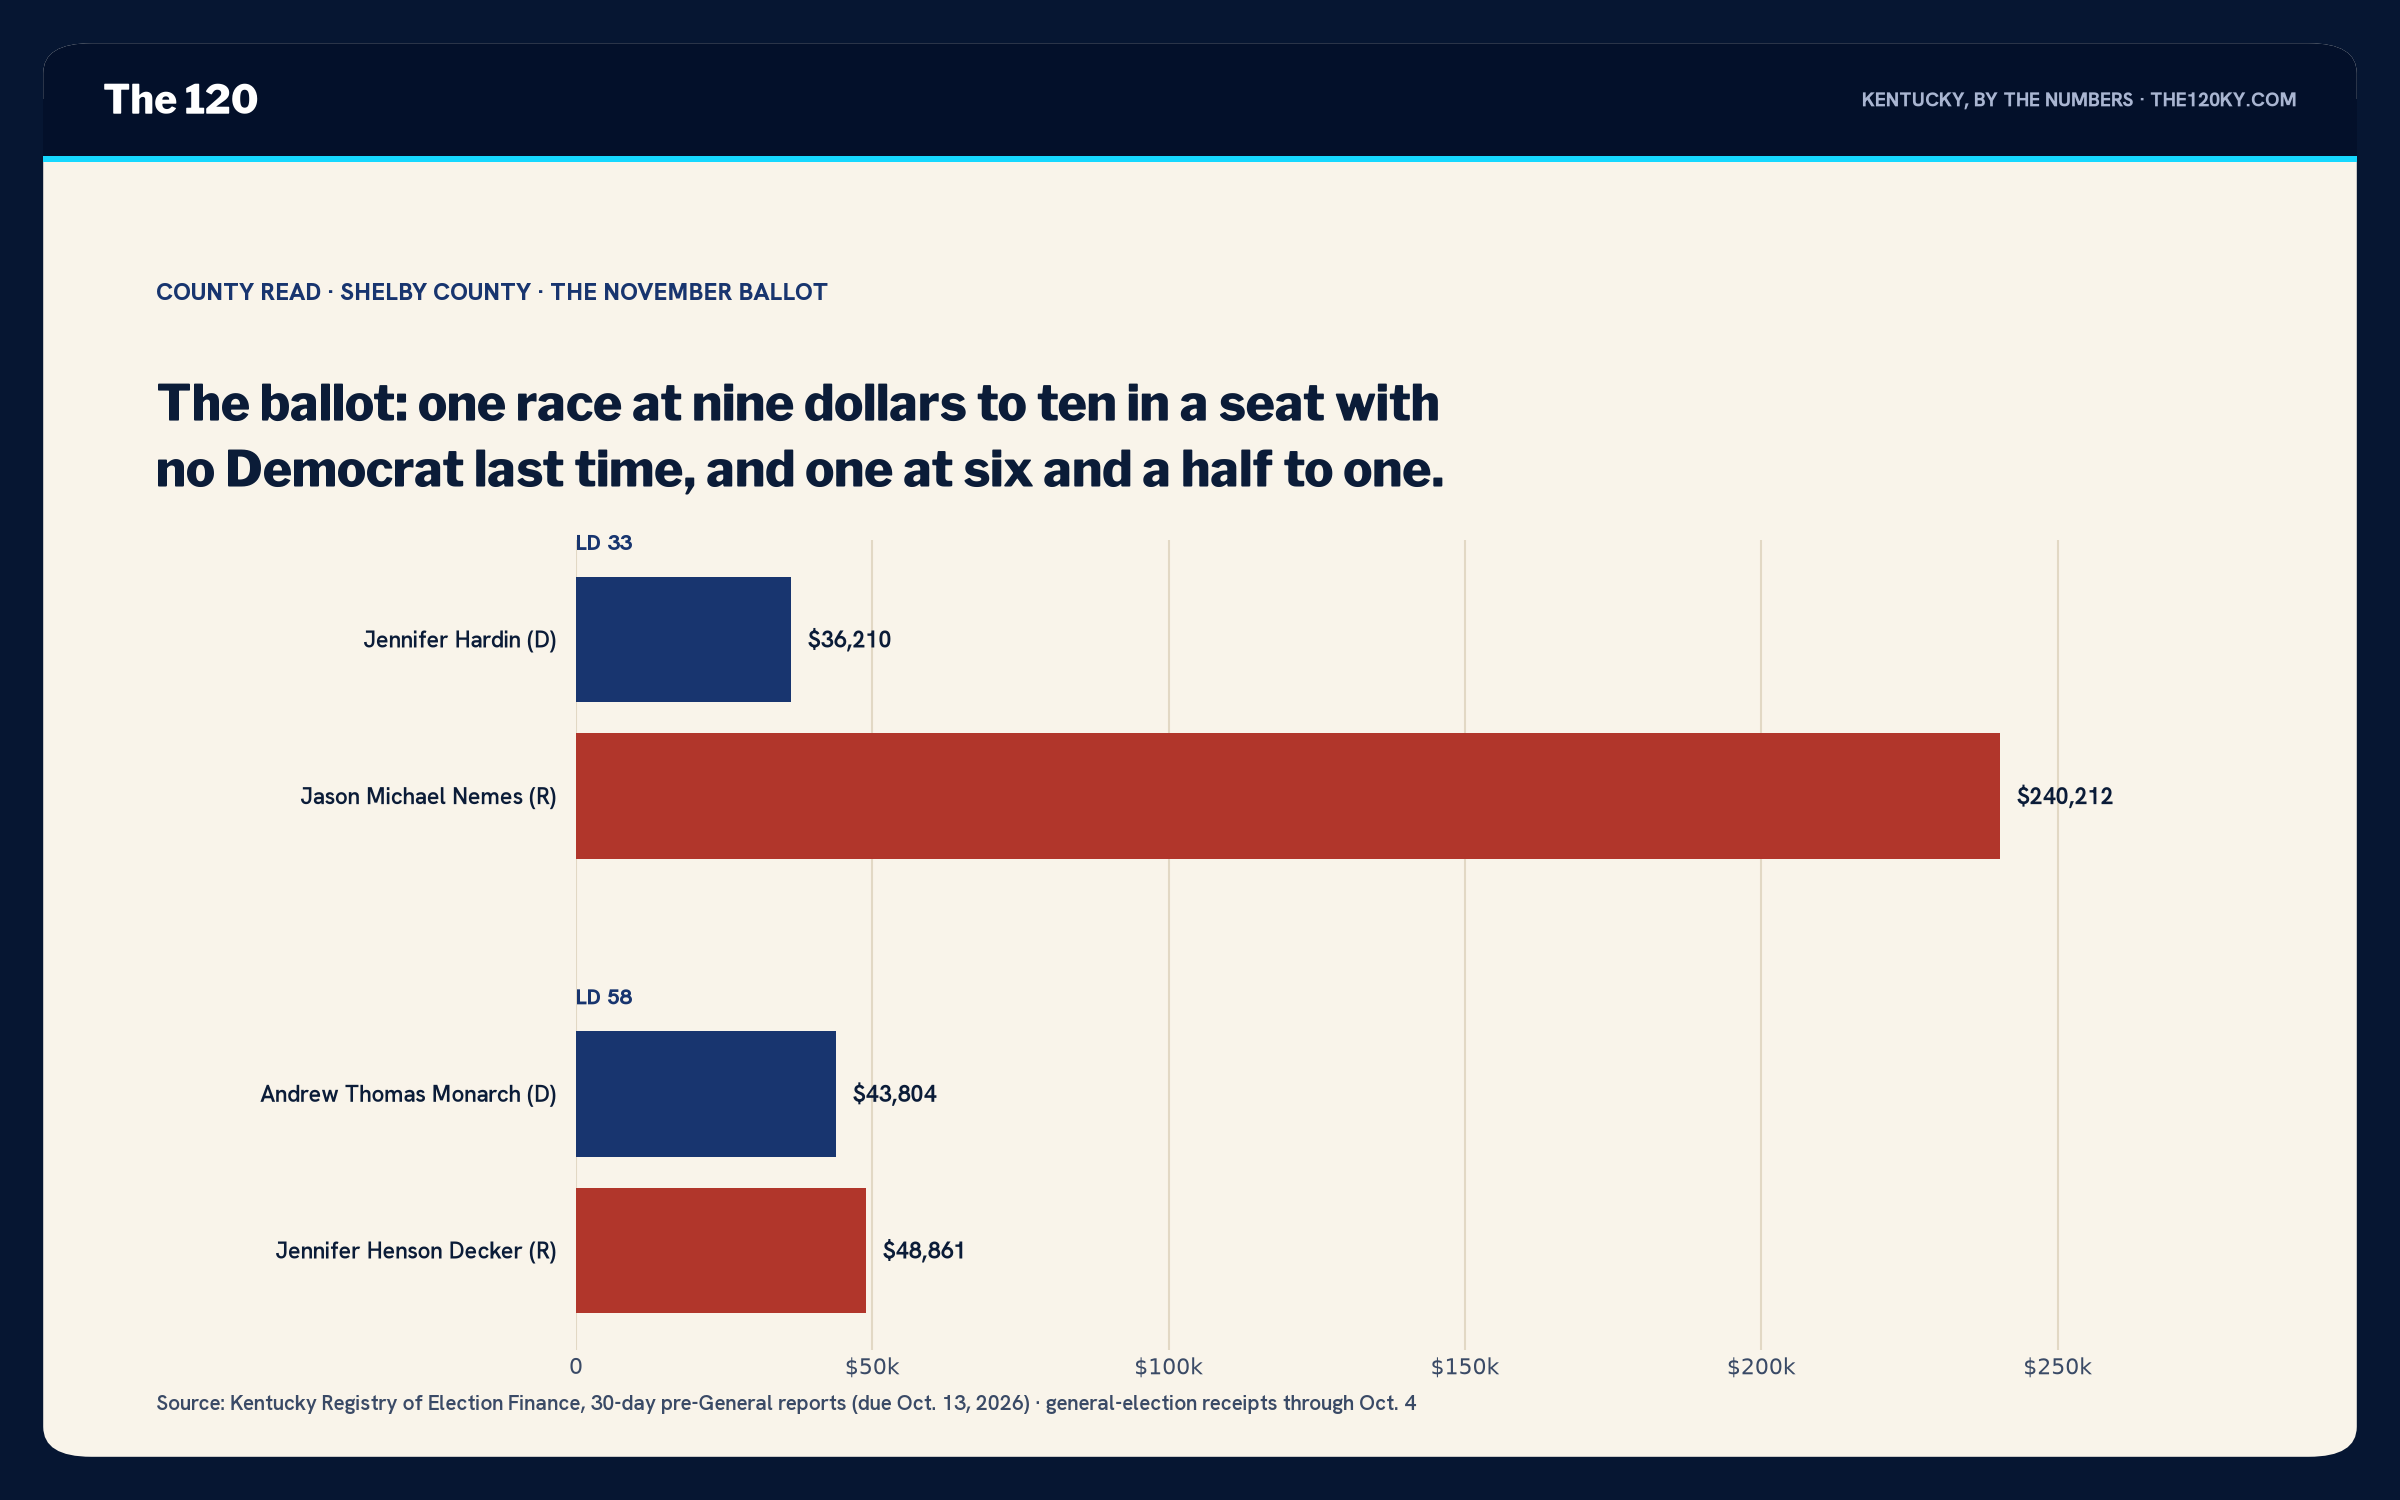
The 58th is Jennifer Henson Decker's: 32 of Shelby's 34 precincts, all eleven flip precincts, and the rest of the district outside the county. She had no Democrat in 2024 and won 17,330 to nothing. This year Andrew Monarch filed, and through the 30-day reports he has raised $43,804 to her $48,861. Nine dollars to ten. And it's sitting on a district whose Shelby precincts were Cameron plus 538, where the Democratic column votes at 46% in an off-year, in a county that's adding Republicans by the hundreds and still gave Beshear 47.6. At the 60-day deadline it was $41,722 to $46,361, the same nine to ten, so the ratio didn't move in a month, which in this chamber is the unusual part; he has spent $26,610 of his to her $7,392.
I'll say what I've said in the other nineteen, in reverse: this is a Trump-plus-35 county and the district is more Republican than the county, and a Democrat who has raised $44,000 in a seat that had none last time doesn't flip it. What he does is measure it. Monarch's number in the eleven flip precincts against Beshear's 842 is the single cleanest test in this series of whether the Beshear vote is portable to a funded Democrat in a suburban seat, because the funding there is roughly fair.
The 33rd is Jason Nemes's, two Shelby precincts and the rest in eastern Jefferson, and he had raised $172,762 at the 60-day deadline to Jennifer Hardin's $24,210, seven to one. Through the 30-day reports he has raised $240,212 to her $36,210, six and a half to one, and his is now the third-largest account in the House. He won it by fourteen in 2024. That's a Louisville race, and I covered it there.
The read. Shelby County is the series in miniature. A paper-Democratic county in 2010 that's Republican now because of who moved in. A federal ballot that runs Republican by 30 and a governor's ballot that runs within five. A city that flips and a county that doesn't. Democrats who vote at nearly the Republican rate in an off-year and then lose the county by 805. And one House seat that holds nearly the whole county, had no Democrat two years ago, and this year has one who has raised nine dollars for every ten the incumbent has. If you wanted to design a test of whether the Beshear coalition can be handed to somebody else, you'd build this county and this race. Somebody did.
What I'm watching in November: the 58th's eleven flip precincts against Beshear's 842, and the Democratic turnout rate against 2022's 48.3. If Monarch holds the flip precincts and the Democratic column votes at its 2023 rate, the 58th is a five-point race in a year with no governor on the ballot, and that number travels to every county on this list.
That's twenty. The Sunday before the election, I'll put them together.
Disclosure: I work in Kentucky Democratic politics. I'm not paid by, and don't advise, any candidate named above. I read this county the same way whether or not it's good news for my side; that's the job.