County Read No. 2 · Jefferson County
Jefferson County: Democratic by 16 for president, by 40 for governor, and 32 precincts the Republicans can count on.
The biggest county in Kentucky is 56% Democratic on paper, votes 16 points Democratic in a presidential year and 40 in a Beshear year, and its registered Republicans have out-voted its registered Democrats in the last two federal elections. Eighteen House seats sit inside it. Seven are Republican. This year the Democrats are contesting six of them and the Republicans are contesting four of the other eleven.
LOUISVILLE — County Read No. 2 of 20 · Reading the Kentucky general election of November 3, 2026.
Second of twenty, and the one that's a fifth of the whole state. Jefferson County has 588,268 registered voters — one in six Kentuckians on the rolls — and cast 354,094 votes for president in 2024, more than the next three counties combined. If you want to know why the Democratic column in Kentucky isn't dead, this is where the pulse is. If you want to know why it isn't winning statewide, this is also where you find out, because Jefferson's number has a ceiling and the rest of the state knows exactly where it is.
Same five questions as last week: the paper, the ballots, the turnout, the map, the money.
What the paper says. As of the August file: 326,795 Democrats, 186,123 Republicans, 75,350 in neither column. That's 55.6% Democratic, 31.6% Republican, 12.8% no-party. In 2010 it was 59% Democratic and 32.5% Republican, with 8.6% unaffiliated. So the county has moved three and a half points off the Democratic line in sixteen years, almost all of it into the no-party column, not the Republican one. Republicans are a smaller share of Jefferson's voters than they were when Rand Paul first ran.
One more thing the paper says, and it matters this year: the county has 42,886 fewer registered voters than it had on Election Day 2024. That's the Secretary of State's cleanup, which I wrote about in September — 166,235 names off the rolls statewide since November, and Jefferson took a quarter of it. Here the cut came from both columns: 25,839 Democrats and 17,399 Republicans. As a share of the column, the Republicans lost slightly more. In eastern Kentucky the purge was a Democratic story. In Louisville it was just a purge.
What the ballots say. Jefferson has two numbers and they're twenty-four points apart.
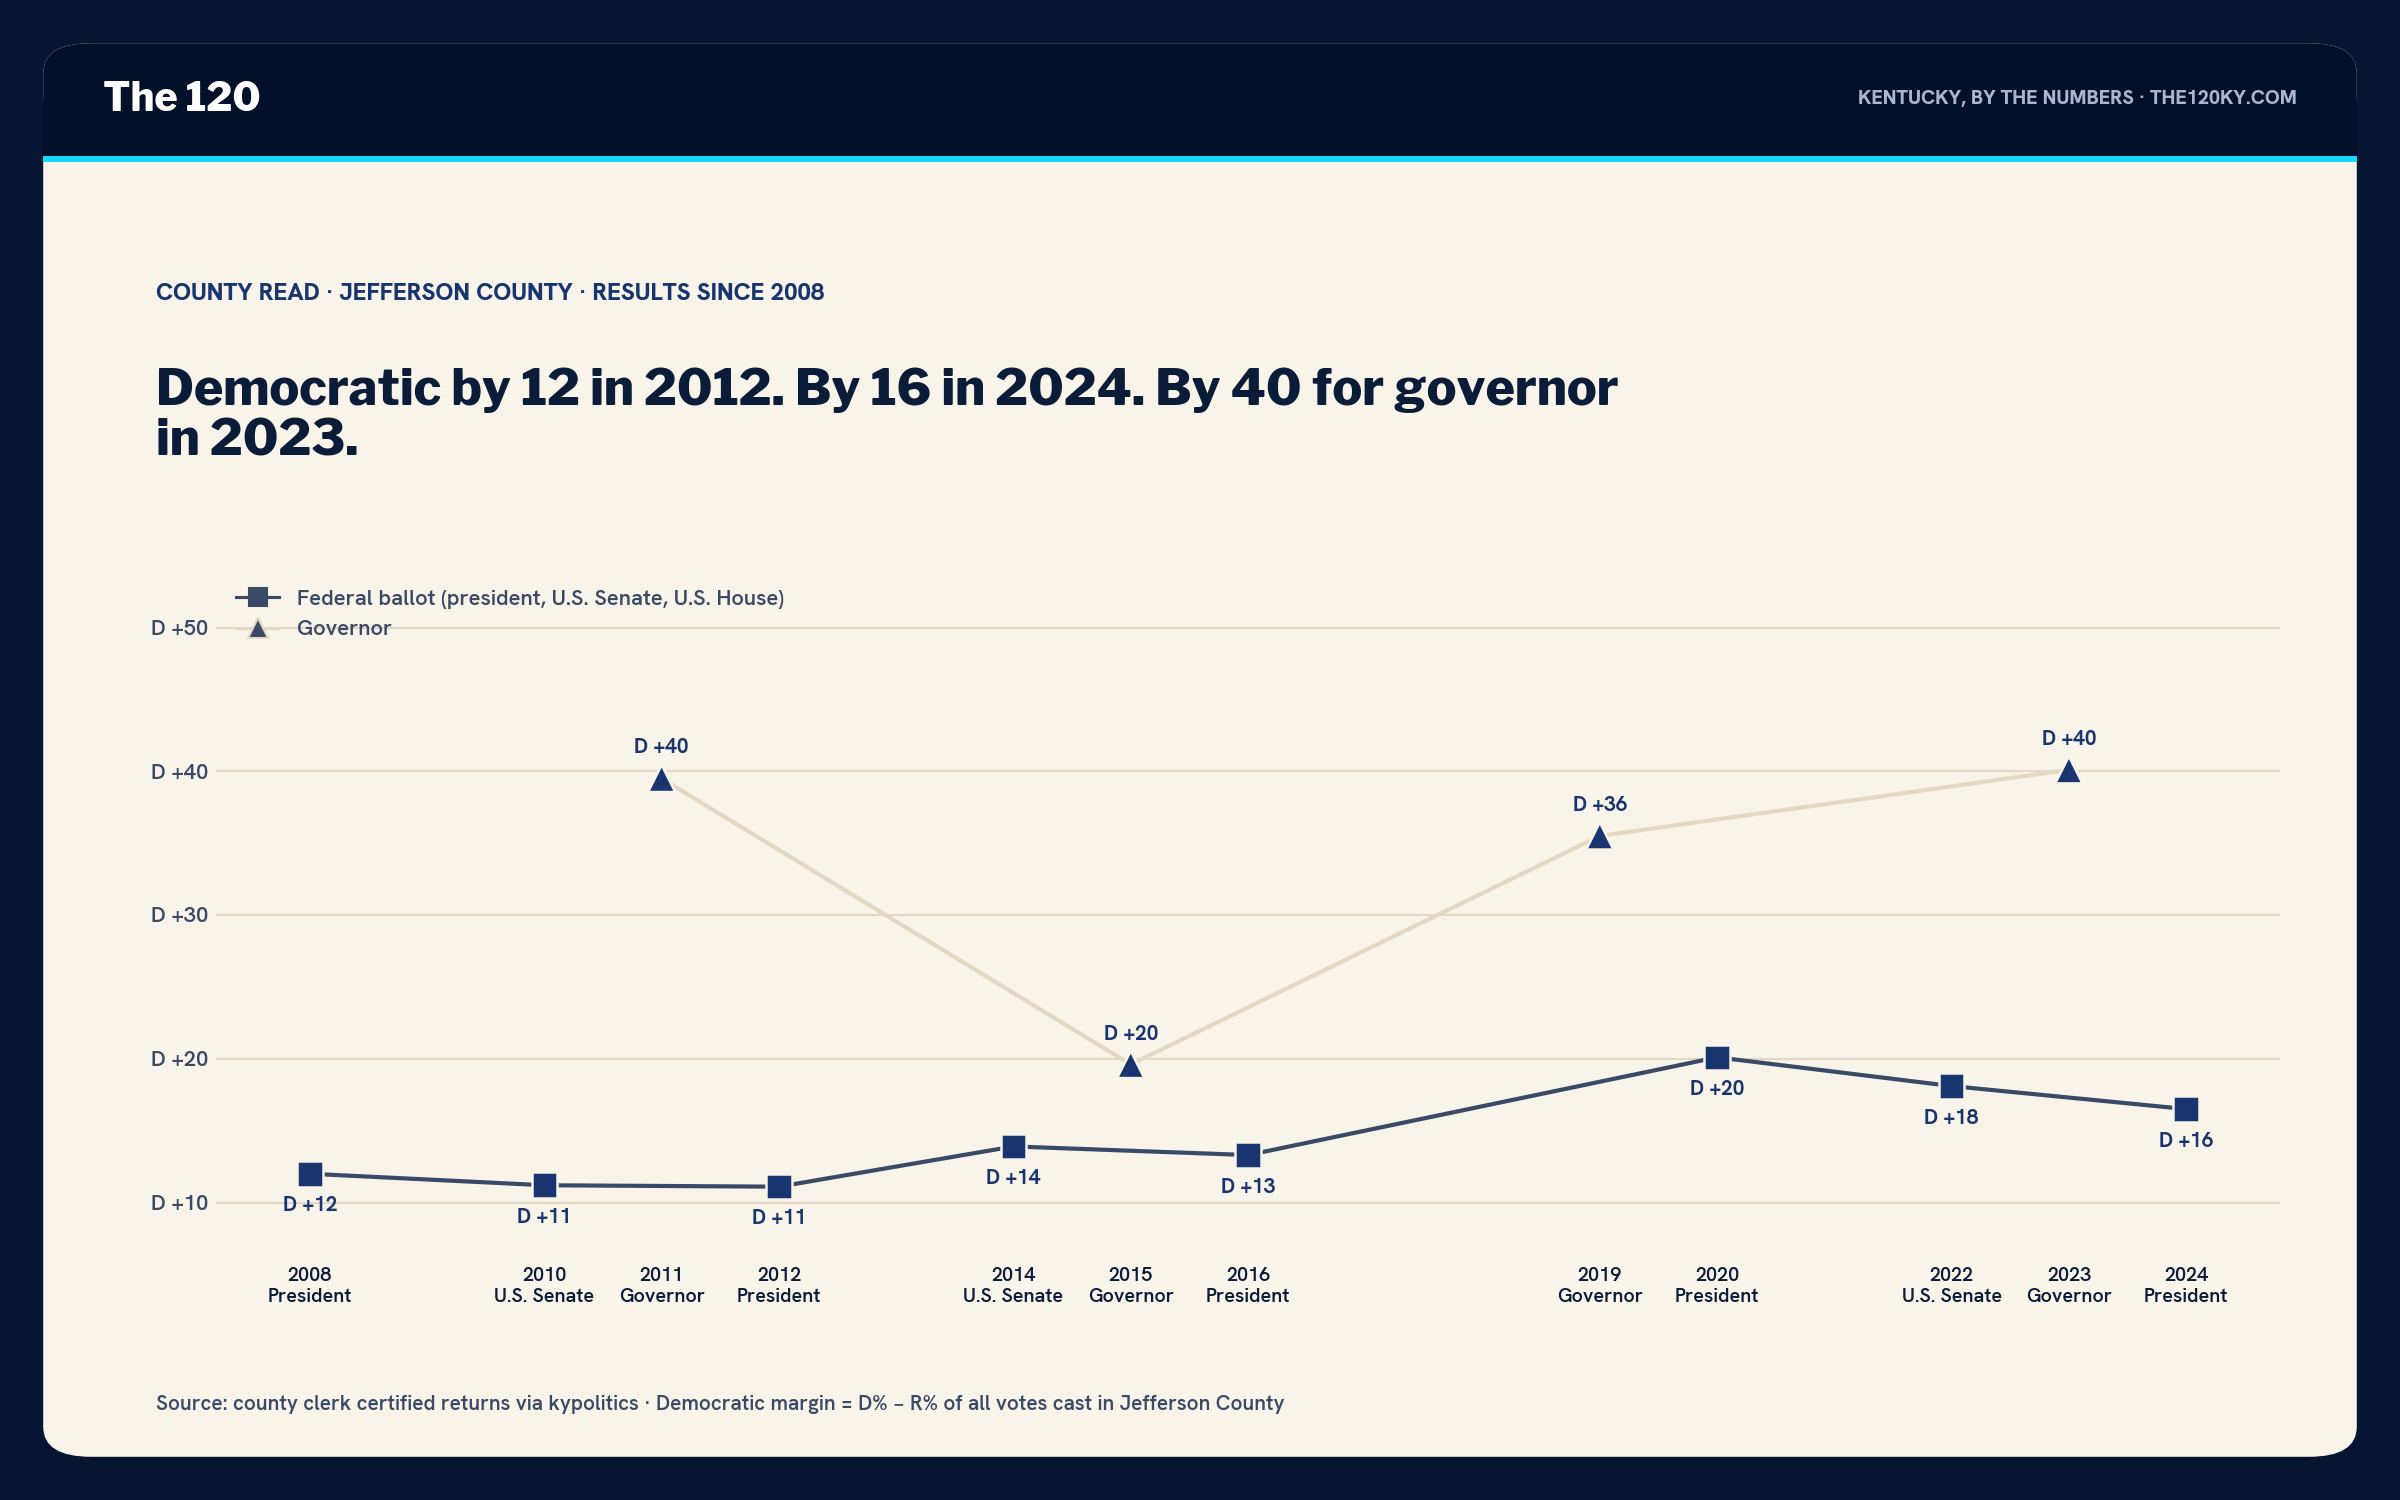
On a federal ballot, Jefferson County is a Democratic county by eleven to twenty points, and it has been for as long as I have data. Obama carried it by 11 in 2012, Clinton by 13, Biden by 20, Harris by 16.5 — 203,070 to 144,553, a 58,517-vote margin that Trump erased in the rest of the state by lunch. The 2020 number is the high-water mark and the 2024 number is a step back from it, in a year the whole state moved right; Jefferson moved less than almost anywhere, but it moved.
On a governor's ballot, it's a different county. Beshear carried it by 36 in 2019 and by 40 in 2023 — 179,854 to 76,908, a 102,946-vote margin, in an electorate nearly 100,000 people smaller than the one that gave Harris 58,517. Bevin managed to hold Conway to 20 in 2015, which tells you the governor's line isn't magic; it's the candidate. But the shape holds: Jefferson gives a Democrat for governor roughly two and a half times the percentage margin it gives a Democrat for president, and the entire difference is Republicans and no-party voters who split the ticket. There are a lot of them, and I'll show you where they live in a minute.
Who's turning out. This is the number that should bother my side.
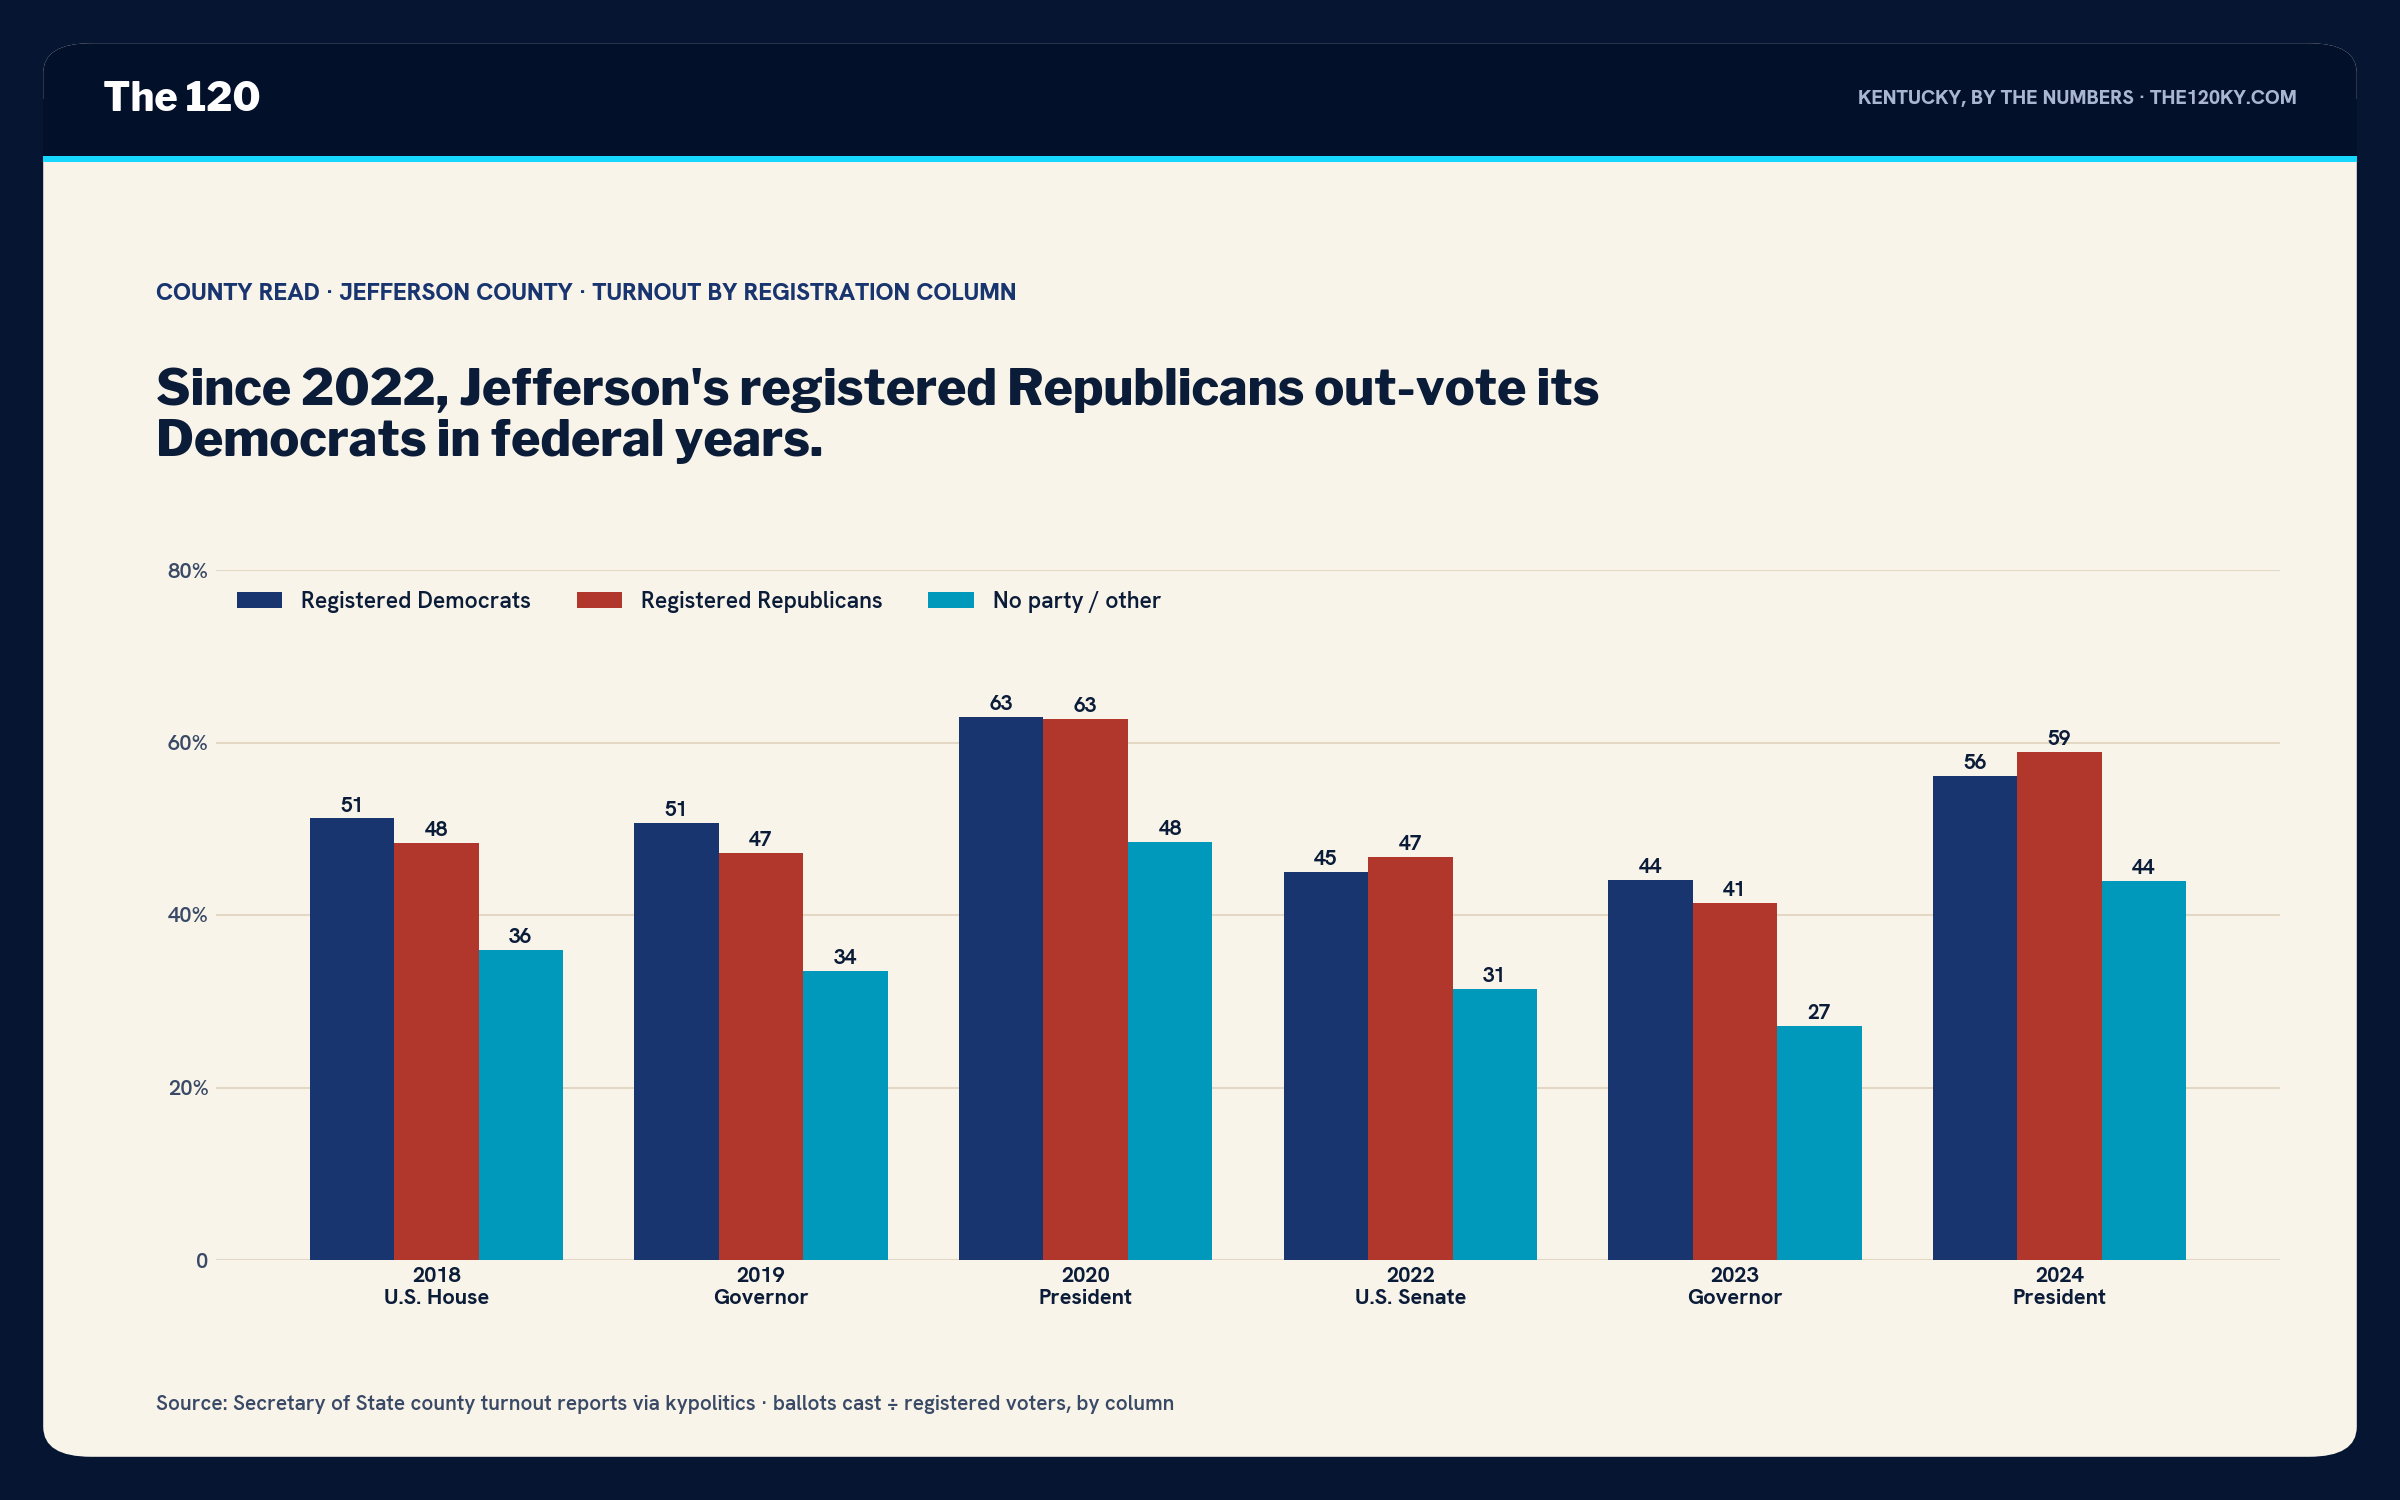
In 2018, 51.2% of Jefferson's registered Democrats voted and 48.4% of its registered Republicans did. In 2019, 50.7 to 47.2. Then 2020 was a tie, 63 to 63, and since then the order has flipped: in 2022 the Republicans out-voted the Democrats 46.7 to 45.0, and in 2024 it was 58.9 to 56.1. The only year since 2020 the Democratic column showed up better than the Republican one was 2023, 44.1 to 41.4 — the Beshear year — and even that gap is smaller than it was in 2018 or 2019.
That's the Jefferson County version of the statewide story I wrote in September, and it's milder here than anywhere in the east. But it's the same direction, and it's the reason the county's presidential margin went from 20 to 16 in four years: the Democratic column in Louisville is aging, some of it is on paper only, and the people who are actually Democrats in 2026 aren't all in it. The 351,595 registered Democrats of 2023 cast 155,203 ballots. That's 196,000 registered Democrats who didn't vote at all in the Beshear election. The 42,886 the state just removed came out of that pool.
The no-party column is 75,350 voters, one in eight, and it turns out at 27 to 31% in a non-presidential year against 41 to 47% for the parties. That's ten to eleven thousand ballots a year that the third column leaves on the table relative to the major-party rate. In a 340-vote House district it's the whole race. Which brings me to the map.
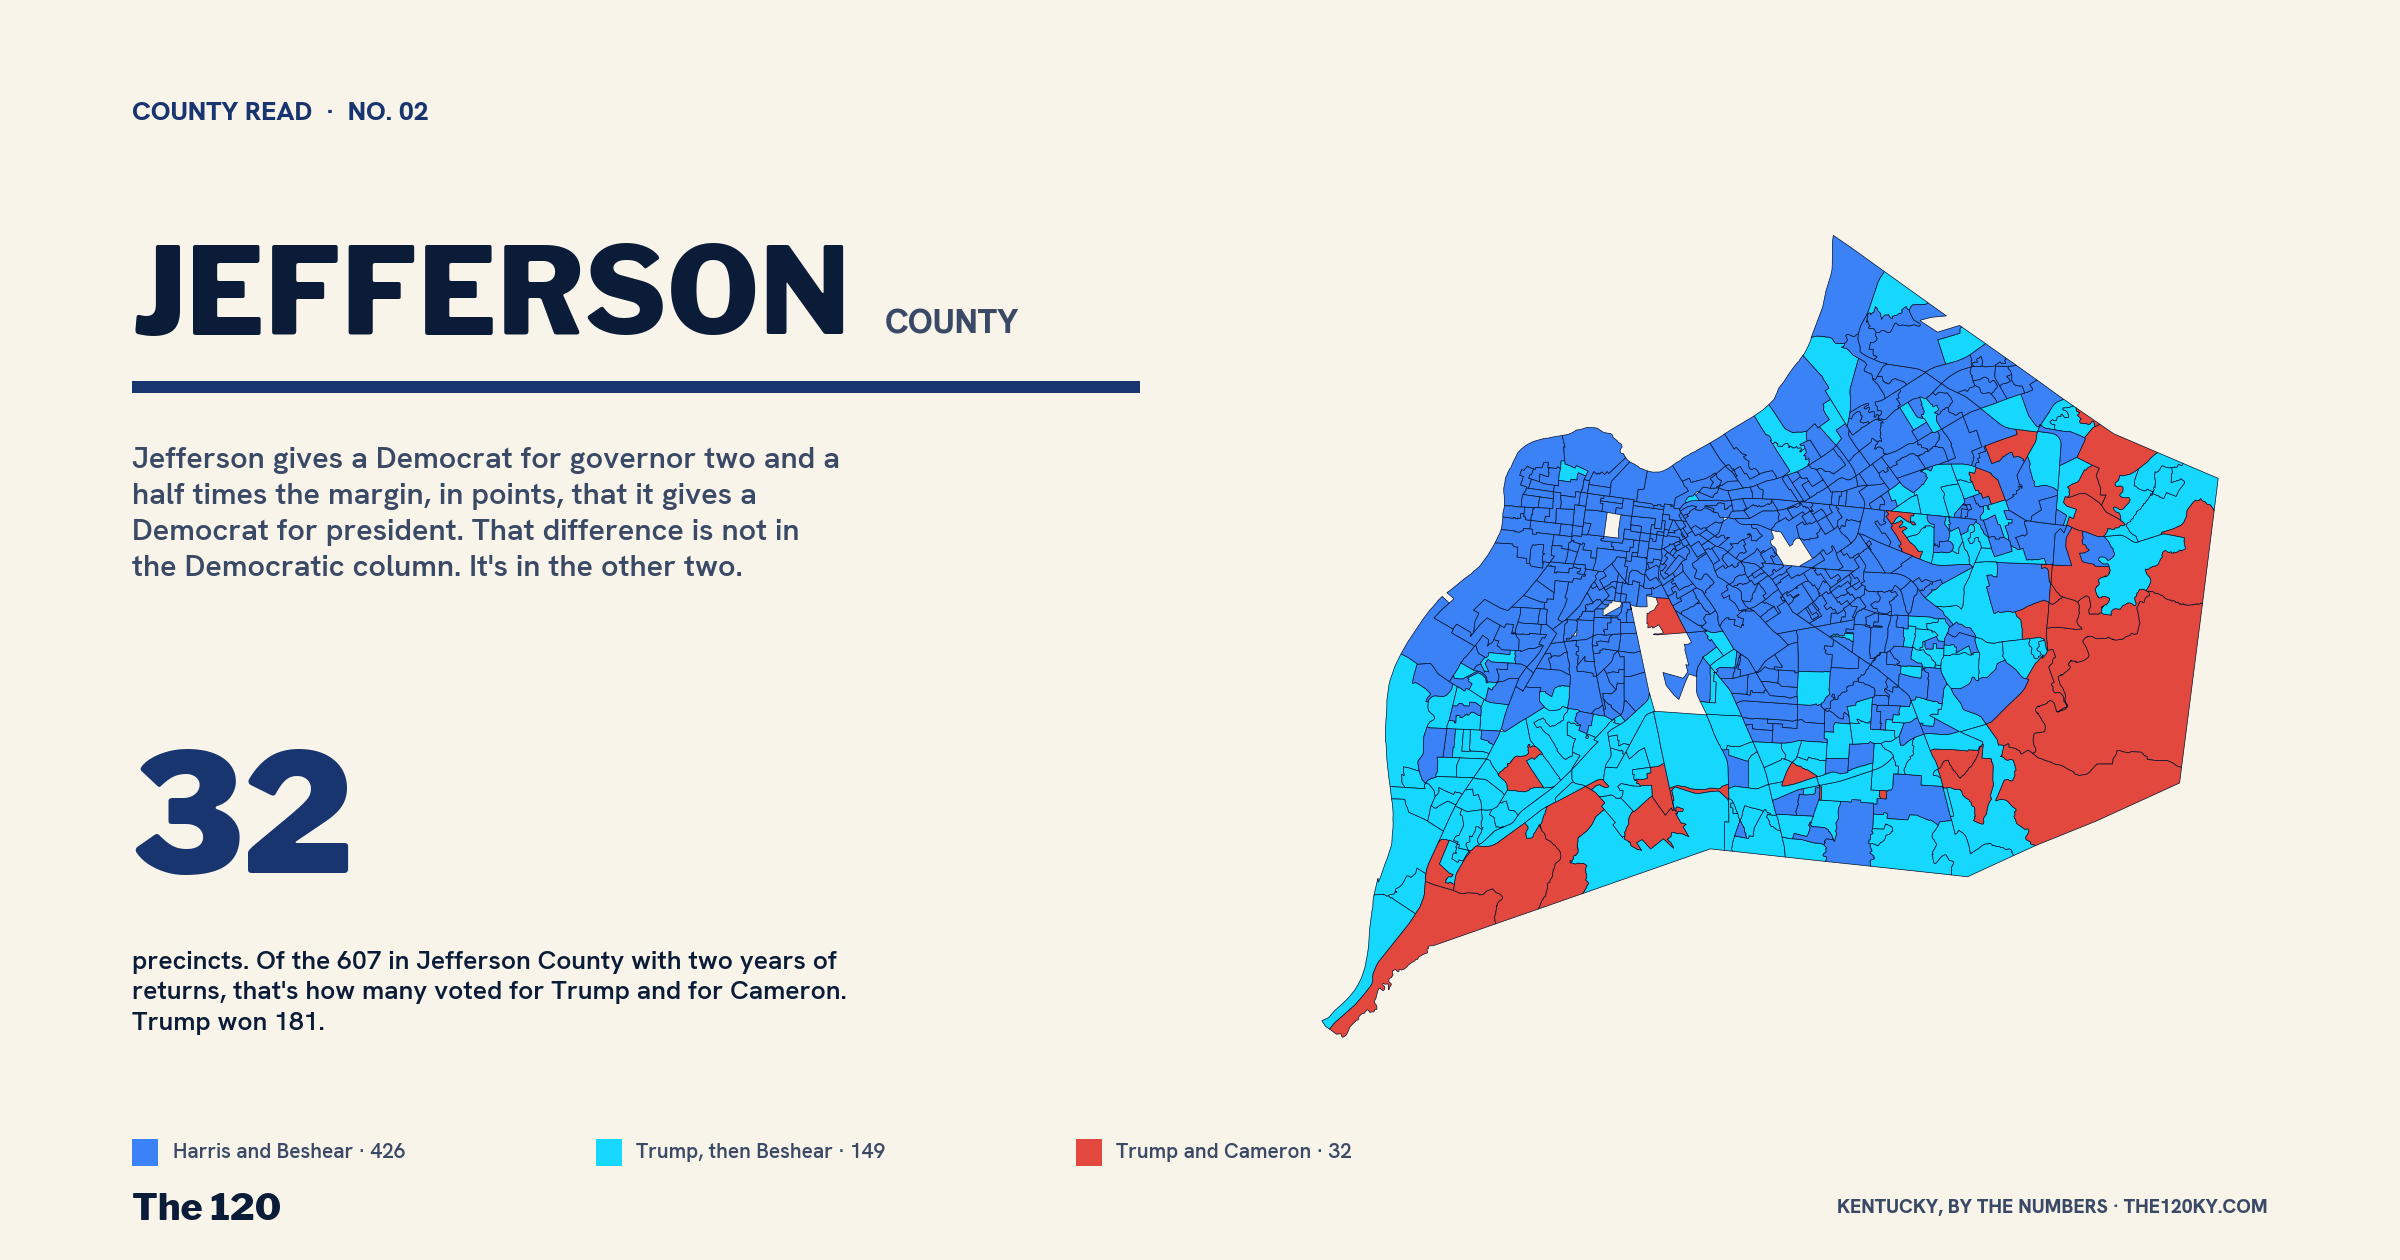
Jefferson gives a Democrat for governor two and a half times the margin, in points, that it gives a Democrat for president. That difference is not in the Democratic column. It's in the other two.
Where it happens. Six hundred and seven precincts with two years of returns, and the three-election test sorts them like this.
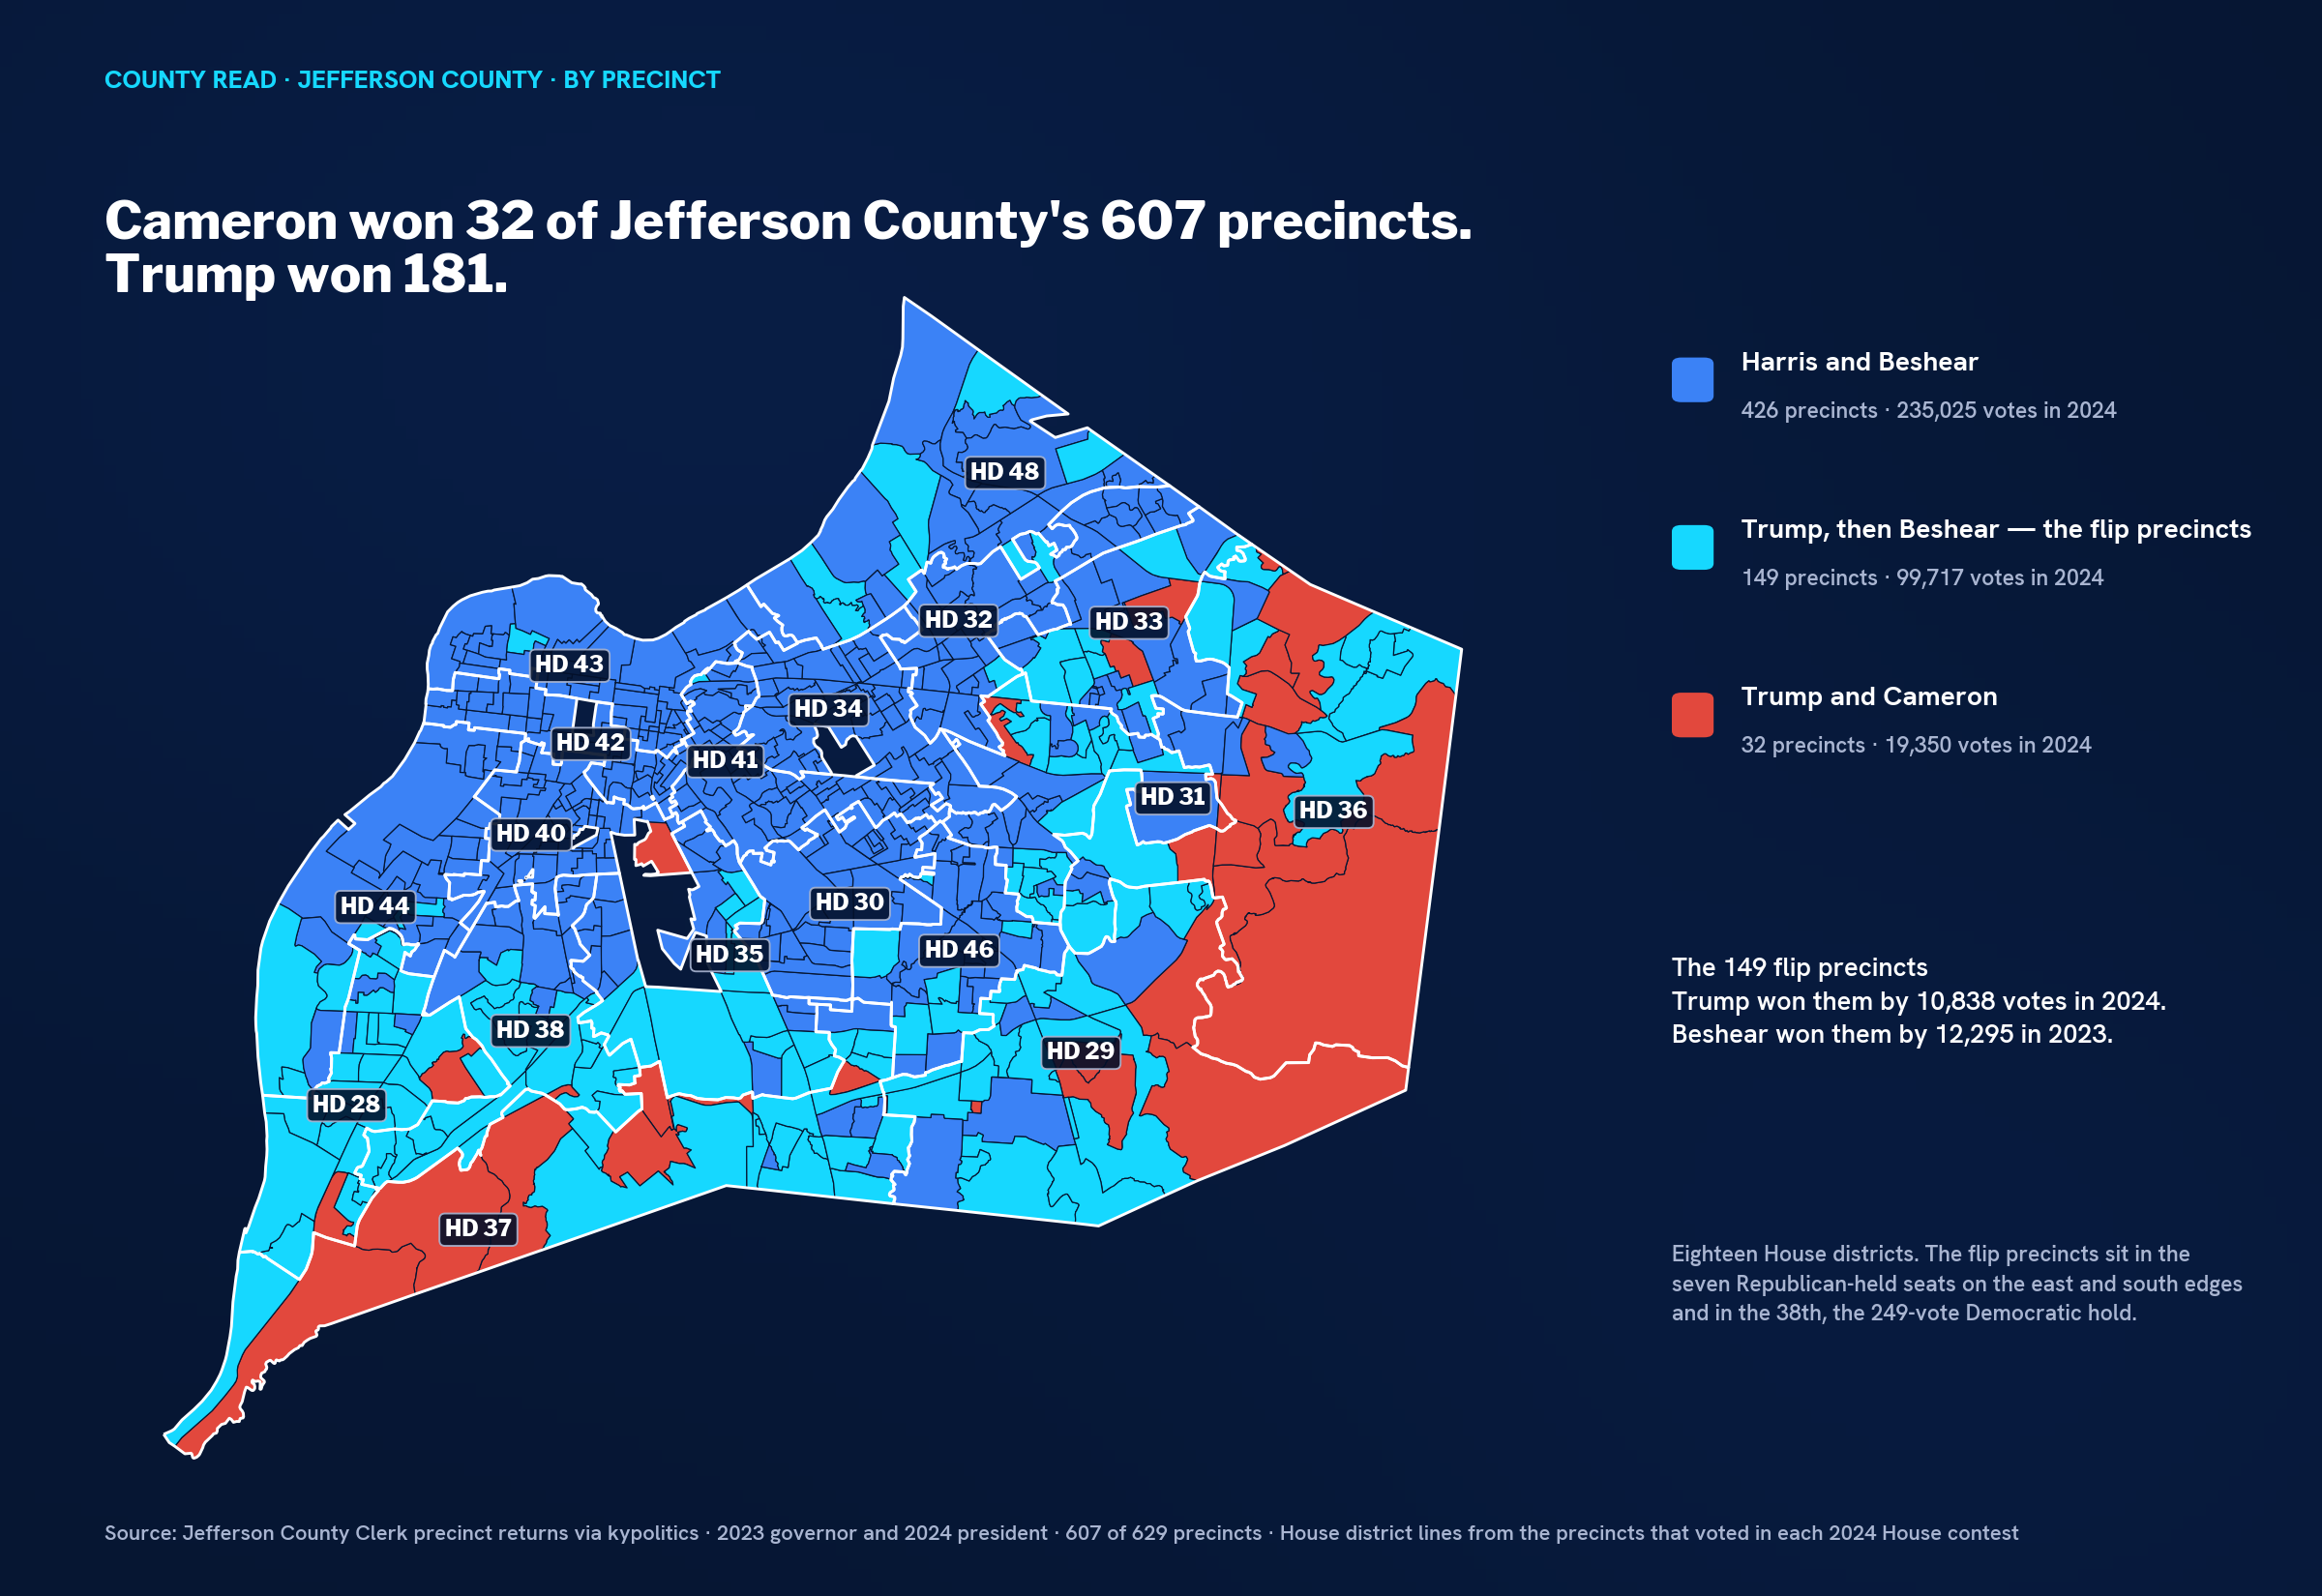
Four hundred and twenty-six precincts voted for Harris and for Beshear — 235,025 votes, Harris by 75,001, Beshear by 91,961. That's the city — the west end, the core, the Highlands, most of what's inside the Watterson — and it's where the entire Democratic margin in Kentucky comes from.
Thirty-two precincts voted for Trump and for Cameron — 19,350 votes, Trump by 5,646, Cameron by 1,309. That is the Republican floor in Jefferson County. Thirty-two precincts, mostly in the 36th on the far east edge and a handful in the 29th and 37th at the south end, where Daniel Cameron won by a combined 1,309 votes. Everything else in this county is either Democratic or persuadable.
And 149 precincts voted for Trump in 2024 and for Beshear in 2023. Trump won them by 10,838. Beshear won them by 12,295. Those 149 are mostly the East End and the far south: 121 of them sit in the 28th, 29th, 31st, 36th, 37th and 38th and the Jefferson pieces of the 33rd and 48th. They cast 99,717 votes in 2024 — 28% of the county — and they are where every competitive legislative race in Louisville is decided, because they're the precincts where a Republican for president and a Democrat for governor are the same voter.
The seven Republican-held House seats are built out of those precincts. In the 28th, 23 of the 29 precincts are flip precincts. In the 29th, 19 of 30. In the 37th, 18 of 29. In the 31st, 17 of 36, and Harris carried the district by 780 while it sent a Republican to Frankfort by 340. And in the 38th — the one Democratic seat on this list, Rachel Roarx's 249-vote hold — 19 of 33 precincts flipped; Trump won the district's precincts by 245 and Beshear won them by 3,734. That's a seat held by ticket-splitters, and holding it means keeping every one of them.
What's on the ballot, and who's paying. Eighteen House seats. Democrats hold eleven, Republicans seven. Here's the part I'd put on the wall in both party headquarters: this year the Democrats are contesting six of the seven Republican seats, and the Republicans are contesting four of the eleven Democratic ones. Eight of the eighteen lines have one name on them.
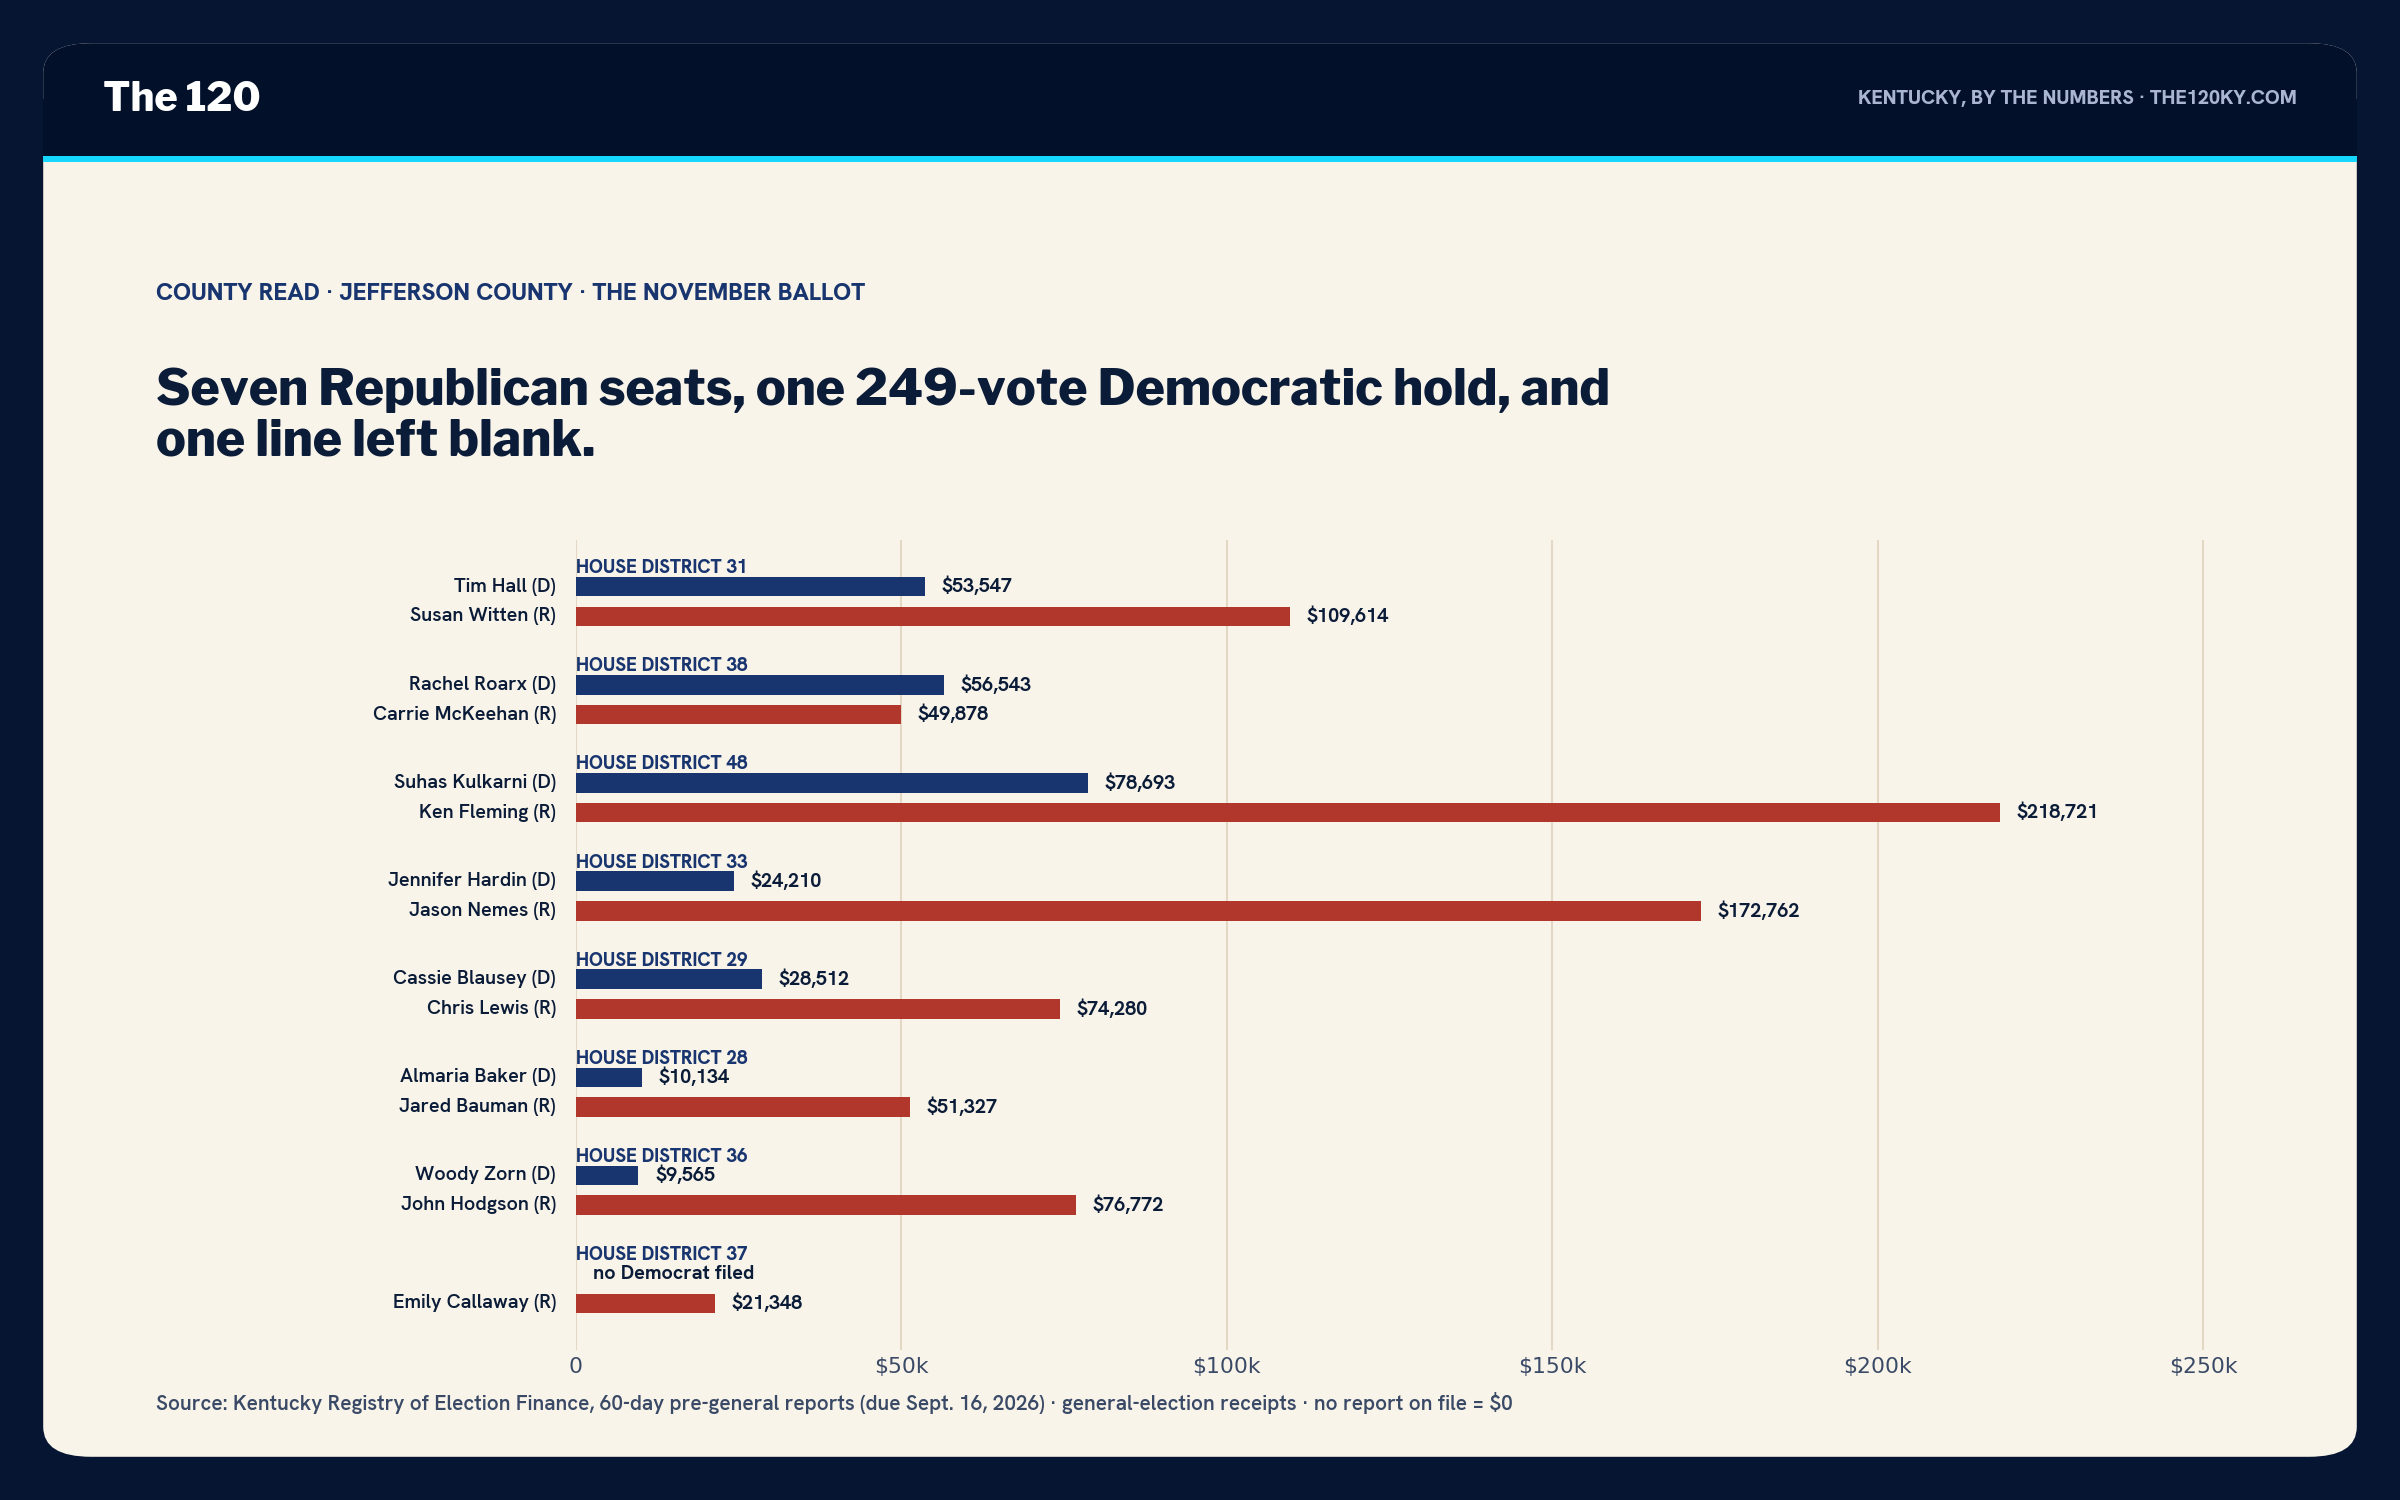
House District 31 — the 340-vote seat. Susan Witten held it by 340 in 2024 in a district Harris carried. Tim Hall is the Democrat, and he's reported $53,547 against her $109,614. Two to one is not a bad ratio in a seat this close, and Witten has spent almost none of hers. This is the pickup on the board, the same as it was in August, and the money says both sides know it.
House District 38 — the 249-vote hold. Roarx has $56,543 to Carrie McKeehan's $49,878, which is the only seat in the county where the money is close, and she's spent $17,280 of it already — more than any other Democrat on this chart. A 249-vote incumbent who is spending in September is an incumbent who read her own precinct returns.
House District 48. Ken Fleming, $218,721, the best-funded Republican on this ballot, against Suhas Kulkarni at $78,693 — which, as I said in the Oldham piece, is the best-funded Democratic challenge in the region after Christian Furman. The Jefferson side of this district went Harris +1,446. The Oldham side is why I won't call it Harris territory. Fleming has spent $75,308, which is the most on the chart by a mile; he is running like a man who has looked at the same map I have.
House District 33. Jason Nemes, $172,762, against Jennifer Hardin at $24,210. Seven to one. The 33rd's Jefferson precincts went Harris +579 and Beshear +2,719; the Oldham and Shelby precincts push it back. Not a race this year.
The 28th, 29th and 36th. Jared Bauman $51,327 against Almaria Baker $10,134; Chris Lewis $74,280 against Cassie Blausey $28,512; John Hodgson $76,772 against Woody Zorn $9,565. Five to one, three to one, eight to one. The 28th and 29th are the seats where the map is most tempting — 23 and 19 flip precincts, Beshear +2,989 and +2,475 — and the money says nobody has funded the temptation. The 36th is where eleven of the county's 32 floor precincts live; it's on this chart because honesty means listing it.
The 37th. Emily Callaway, $21,348, and no Democrat. Two years ago John Stovall took 7,450 votes to her 9,128 in the Jefferson portion. This year the line is blank. Eighteen of the district's 29 precincts voted for Beshear in 2023. I don't have a good explanation for leaving that one empty and I'm not going to invent one.
On the other side of the ledger: the Republicans filed against four Democratic incumbents and funded one of them. McKeehan in the 38th is real. Victoria Ligon against Sarah Stalker in the 34th has $1,000, Bret Shultz against Lisa Willner in the 35th has $960, and Brad Woolridge against Al Gentry in the 46th has $1,956, against $24,782, $136,847 and $65,301. Seven Democratic seats — the 30th, 32nd, 40th, 41st, 42nd, 43rd and 44th — have no Republican at all. That's the city, and the Republican Party of Kentucky has correctly decided it isn't worth the filing fee.
The Senate seats I did two weeks ago and won't repeat, except for the one sentence that fits here: the 6th and the 36th are made of the same 149 flip precincts, and the money in the 36th — Adams $475,492 against McIntosh's $34,245 — is the widest gap on any Louisville ballot this year.
The read. Jefferson County is not a county in play and I'm not going to pretend the stakes are the county. The stakes are the 149 precincts along its eastern and southern edges, which decide seven House seats, one Democratic hold and two Senate seats, and which vote for a Republican president and a Democratic governor without seeing any contradiction in it. The Democratic column here is bigger than it is anywhere and it is getting older and lazier; the Republicans out-vote it in a federal year now, which was not true five years ago. The no-party column is the only one that's growing and it votes at 30%. A Democrat who wins the 31st or holds the 38th in November will do it by getting the flip precincts to vote the way they did for Beshear, and by getting the third column off the couch. A Republican who holds the 31st will do it by making the flip precincts vote the way they did for Trump. Same voters. Same doors. Whoever knocks them.
What I'm watching in November: the flip-precinct margin in the 31st and the 38th, and the no-party turnout rate countywide. It was 31.4% in 2022. If it clears 35 in Louisville this year, the third column is starting to behave like a column.
Monday: Fayette. And from here the county reads run every weekday — eighteen more, biggest first, the last one the Saturday before the election.
Disclosure: I work in Kentucky Democratic politics and consult campaigns in this state. I have no client relationship with any candidate named above. I read this county the same way whether or not it's good news for my side — that's the job. Registration is the Secretary of State's county reports, 2010 through August 2026. Results and turnout by column are the county clerk's certified returns and the Secretary of State's post-election turnout reports via kypolitics; 607 of Jefferson's 629 current precincts carry both 2023 and 2024 results on current lines, and the precinct figures above cover those 607. Presidential margins for 2008, 2012 and 2016 are checked against the certified county totals. House district lines are the county's current precinct-to-district file; the 33rd, 37th and 48th cross the county line and their district-wide money is shown against their Jefferson-only precinct figures. Money is from the Kentucky Registry of Election Finance's 60-day pre-general reports, due September 16; "no report on file" means none was posted by that date. Candidate filings are the Secretary of State's 2026 general election list.