County Read No. 4 · Kenton County
Kenton County: Republican by 22 for president, Democratic by six for governor, and the biggest turnout gap in the state.
Covington's county was even on paper in 2010 and is Republican by eleven on paper now. Trump carried it by 22 and Beshear carried it by six, twelve months apart. The reason it isn't a swing county in November is the same every year: its registered Republicans out-vote its registered Democrats by three to eleven points, and its no-party column — the biggest share in Kentucky — barely votes at all.
LOUISVILLE — Fourth of twenty, and the first of the three Northern Kentucky counties. Kenton is the biggest of them, the most Democratic of them, and the one where the gap between what the county does for governor and what it does for anything else is widest. Same five questions: the paper, the ballots, the turnout, the map, the money.
What the paper says. Kenton County has 149,379 registered voters on the August file: 53,488 Democrats, 69,985 Republicans, 25,906 in neither column. That's 35.8% Democratic, 46.9% Republican, and 17.3% no-party — the highest no-party share of any county in Kentucky. In 2010 it was 43.2% Democratic and 44.1% Republican, a county that was even on paper. Sixteen years later the Republican column has grown by 22,000 and the Democratic column by 6,700, and the no-party column has doubled, from 13,800 to 25,900. This is the Northern Kentucky pattern and Kenton has it in the purest form: the Democrats didn't collapse the way they did in the east, they just stopped growing, and everybody who moved in registered as something else.
One thing Kenton did that almost no other county did: it grew through the purge. Since Election Day 2024 the state took 166,000 names off the rolls; Kenton's file went up by 2,954 — the Republican column added 1,372, the no-party column added 1,668, the Democratic column lost 86. Louisville lost 42,000 in the same stretch. Lexington lost 21,000. Kenton is a county where people are still arriving faster than the clerks can remove the ones who left.
What the ballots say. Two lines, twenty-seven points apart.
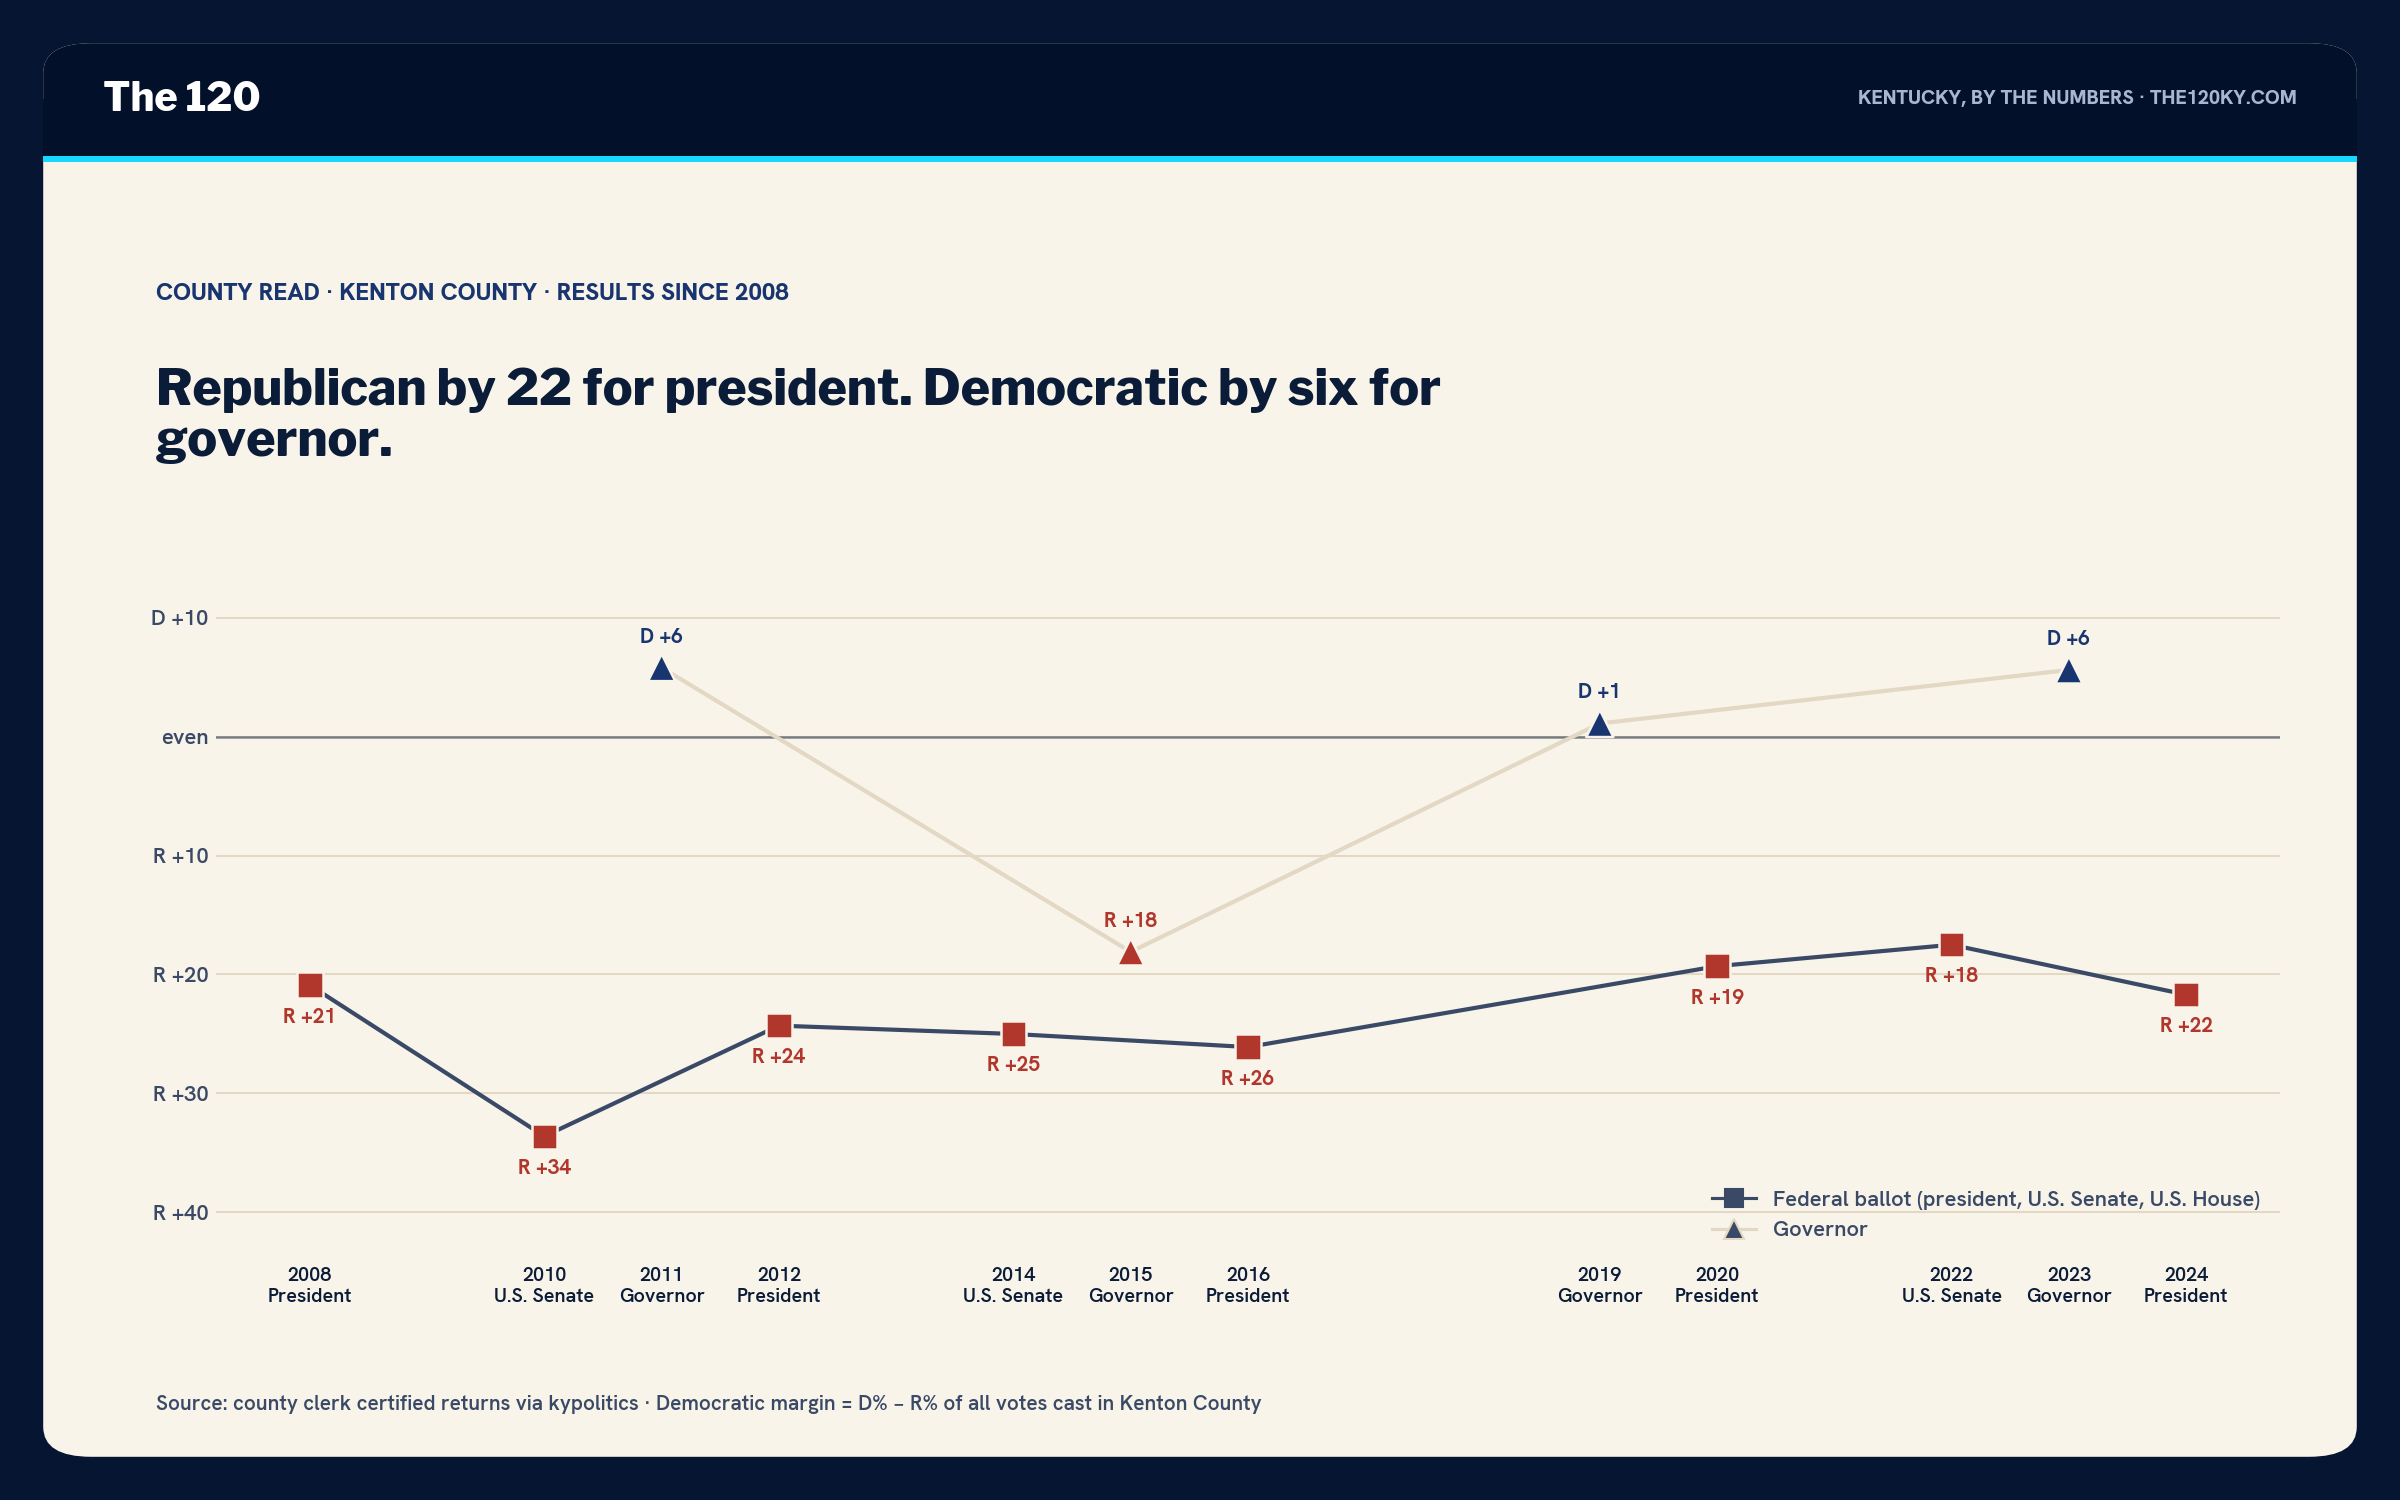
On a federal ballot Kenton is a Republican county by twenty points and has been for as long as I have data: Romney by 24, Trump by 26, then 19, then 22 — 48,444 to 30,859 in 2024, a 17,585-vote margin. The Republican line moved seven points toward the Democrats between 2016 and 2020 and then gave three of them back, which is the Northern Kentucky suburb story in one sentence: it's drifting toward the Democrats on the presidential ballot, slowly, and it isn't there.
On a governor's ballot it's a different county, and not by a little. Andy Beshear carried Kenton by 543 votes in 2019 and by 2,765 in 2023 — 26,066 to 23,301, a 5.6-point win in a county Trump would carry by 22 twelve months later. That's a 27-point swing between the same voters on consecutive Novembers, the biggest of the four counties I've done. Oldham swung 22. Louisville swung 24. Kenton swung 27, and unlike Oldham it swung all the way across the line. Beshear is the only Democrat at the top of a ballot who has carried this county since Steve Beshear did it in 2011.
Who's turning out. This is the number that explains why the 27 doesn't turn into seats.
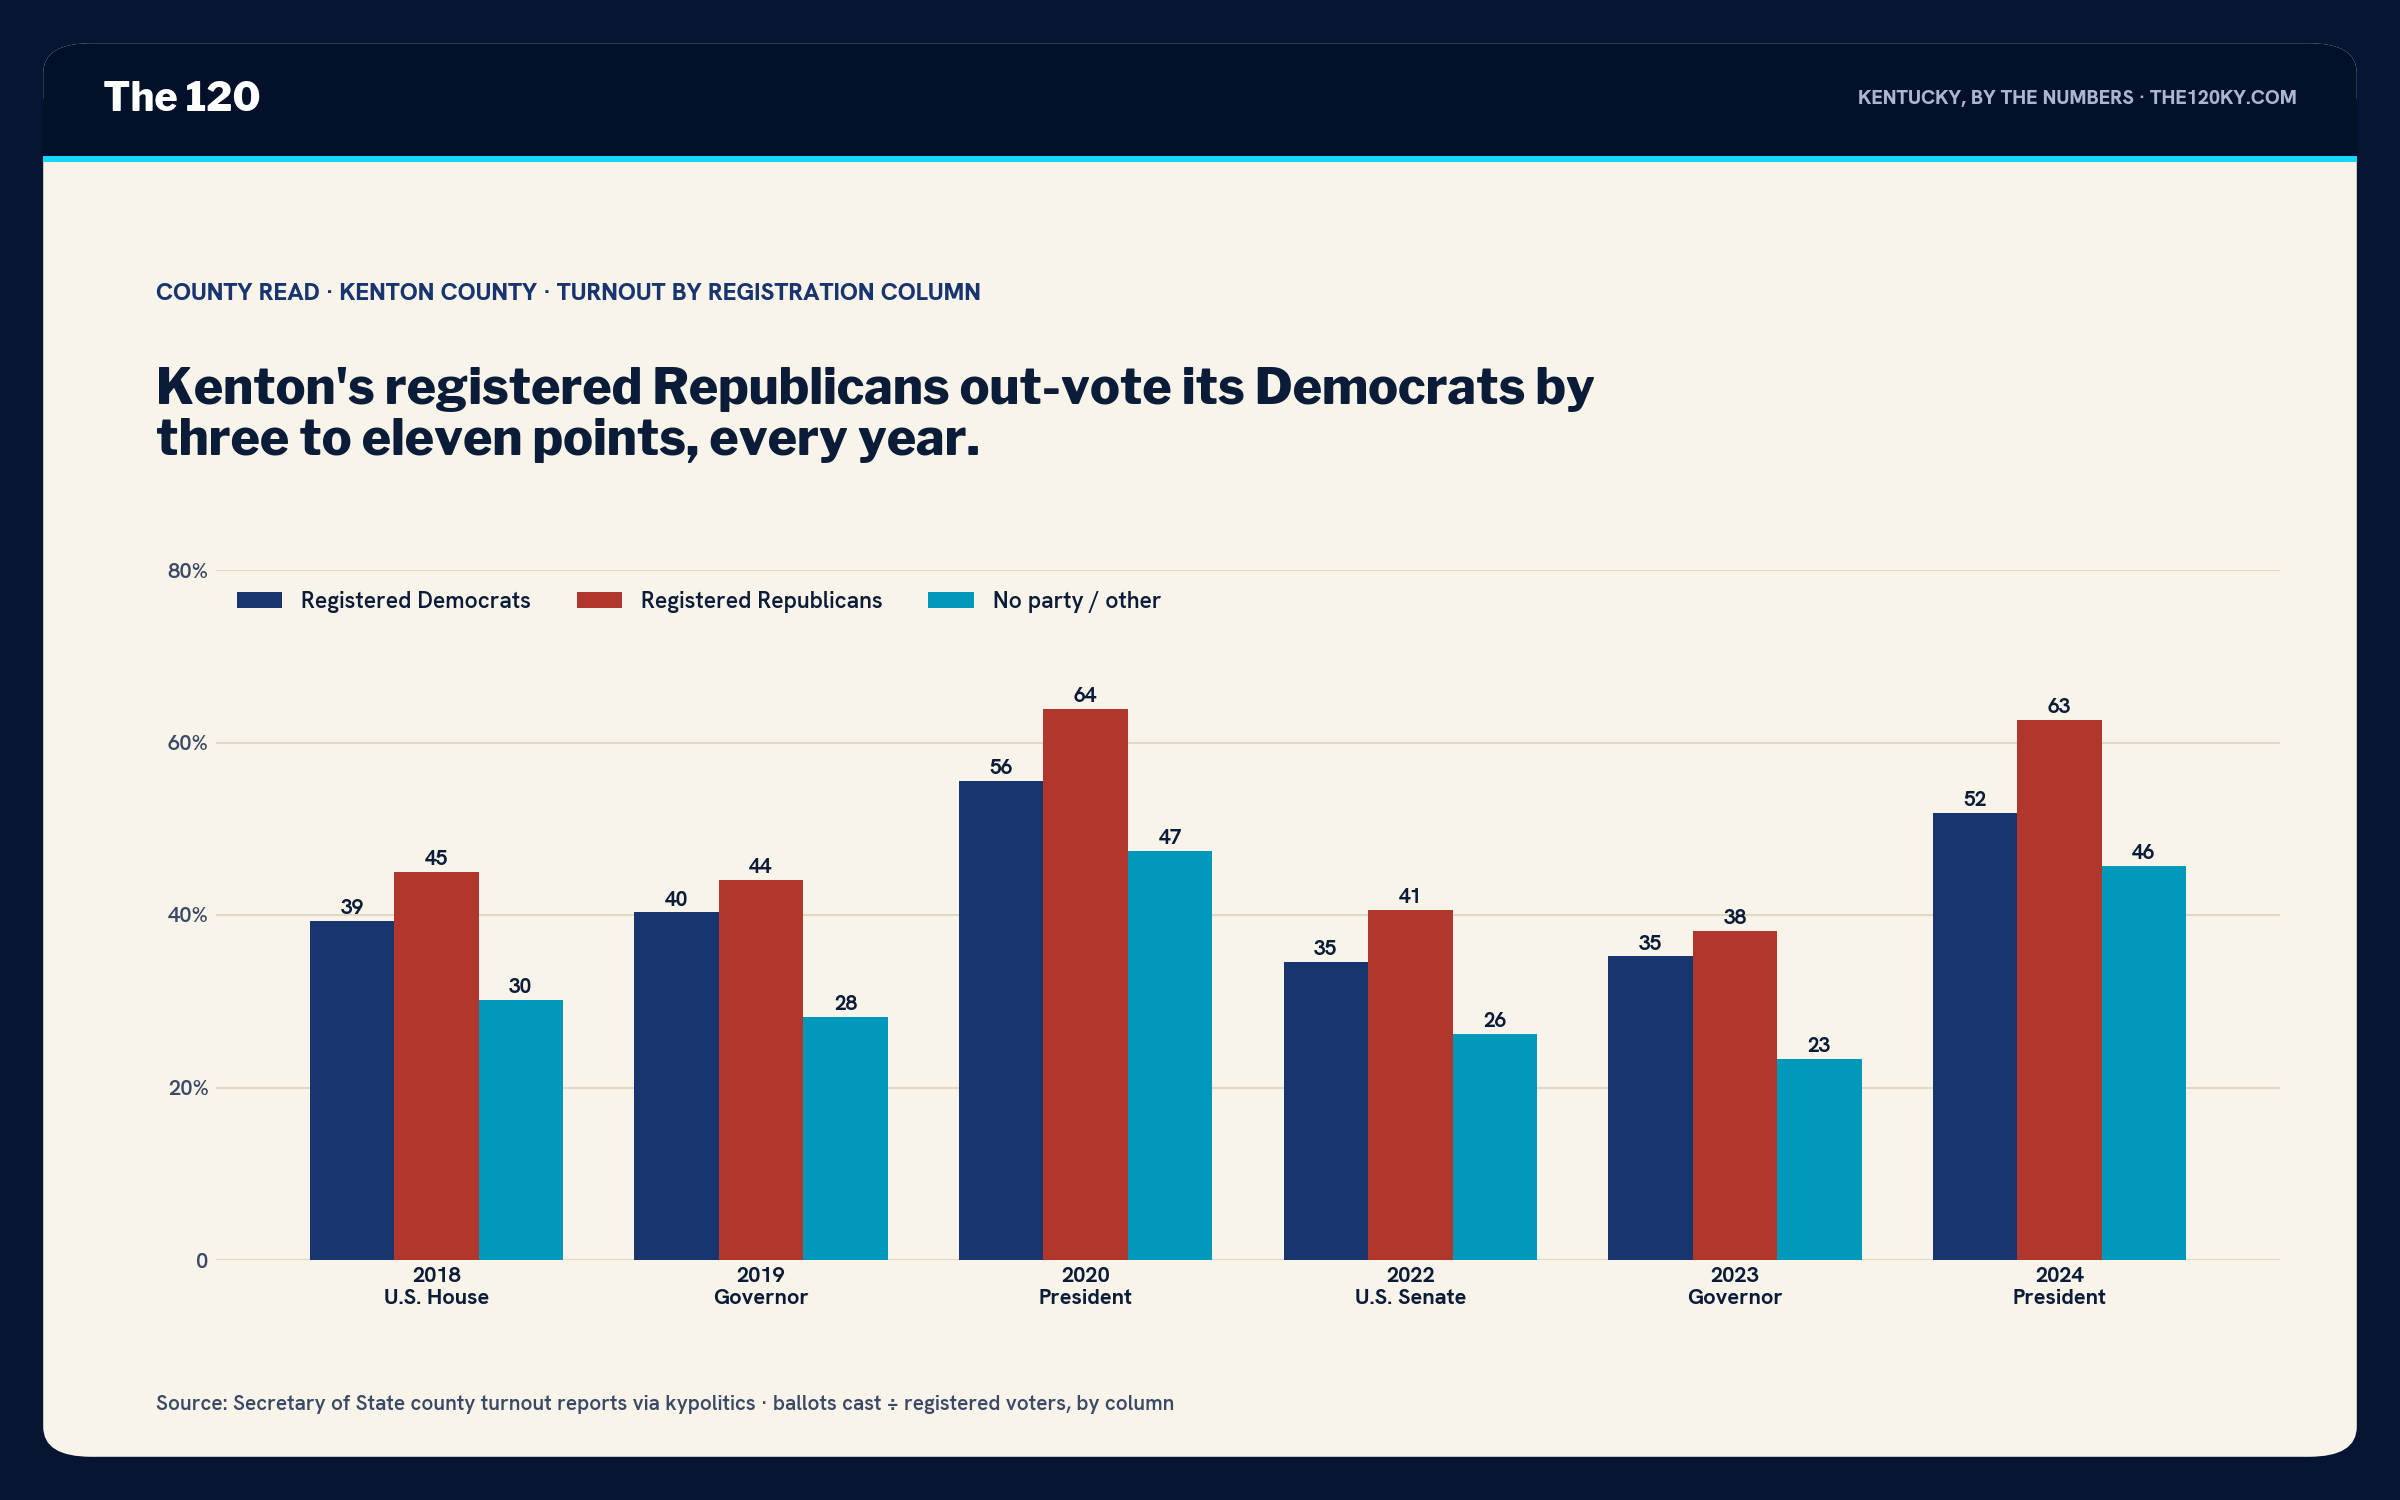
In 2024, 62.6% of Kenton's registered Republicans voted and 51.8% of its registered Democrats did. That's an eleven-point gap, the widest in any county I've looked at this fall — Louisville's was under three, Lexington's was two-tenths the other way. In 2022 it was 40.6 to 34.6, six points. In 2020, 63.9 to 55.5, eight. Even in 2023, the Beshear year, the Republicans out-voted the Democrats, 38.2 to 35.2; Beshear won the county anyway, which tells you how many Republicans crossed. There is no year in the data where Kenton's Democratic column showed up better than its Republican one.
And the third column — 25,906 voters, one in six, the biggest no-party share in the state — votes at 23% in an off-year and 26% in a midterm. At the major-party rate, that's about 3,000 ballots that didn't get cast in 2023 in a county Beshear won by 2,765. In a midterm it's about the same. Northern Kentucky has more voters who belong to neither party than anywhere in Kentucky, and fewer of them vote than almost anywhere in Kentucky, and that is the whole reason a county Beshear carried twice sends six Republicans and no Democrats to the House.
Kenton swings 27 points between a presidential ballot and a governor's ballot. It never swings a legislative seat, because the column that would swing it doesn't vote.
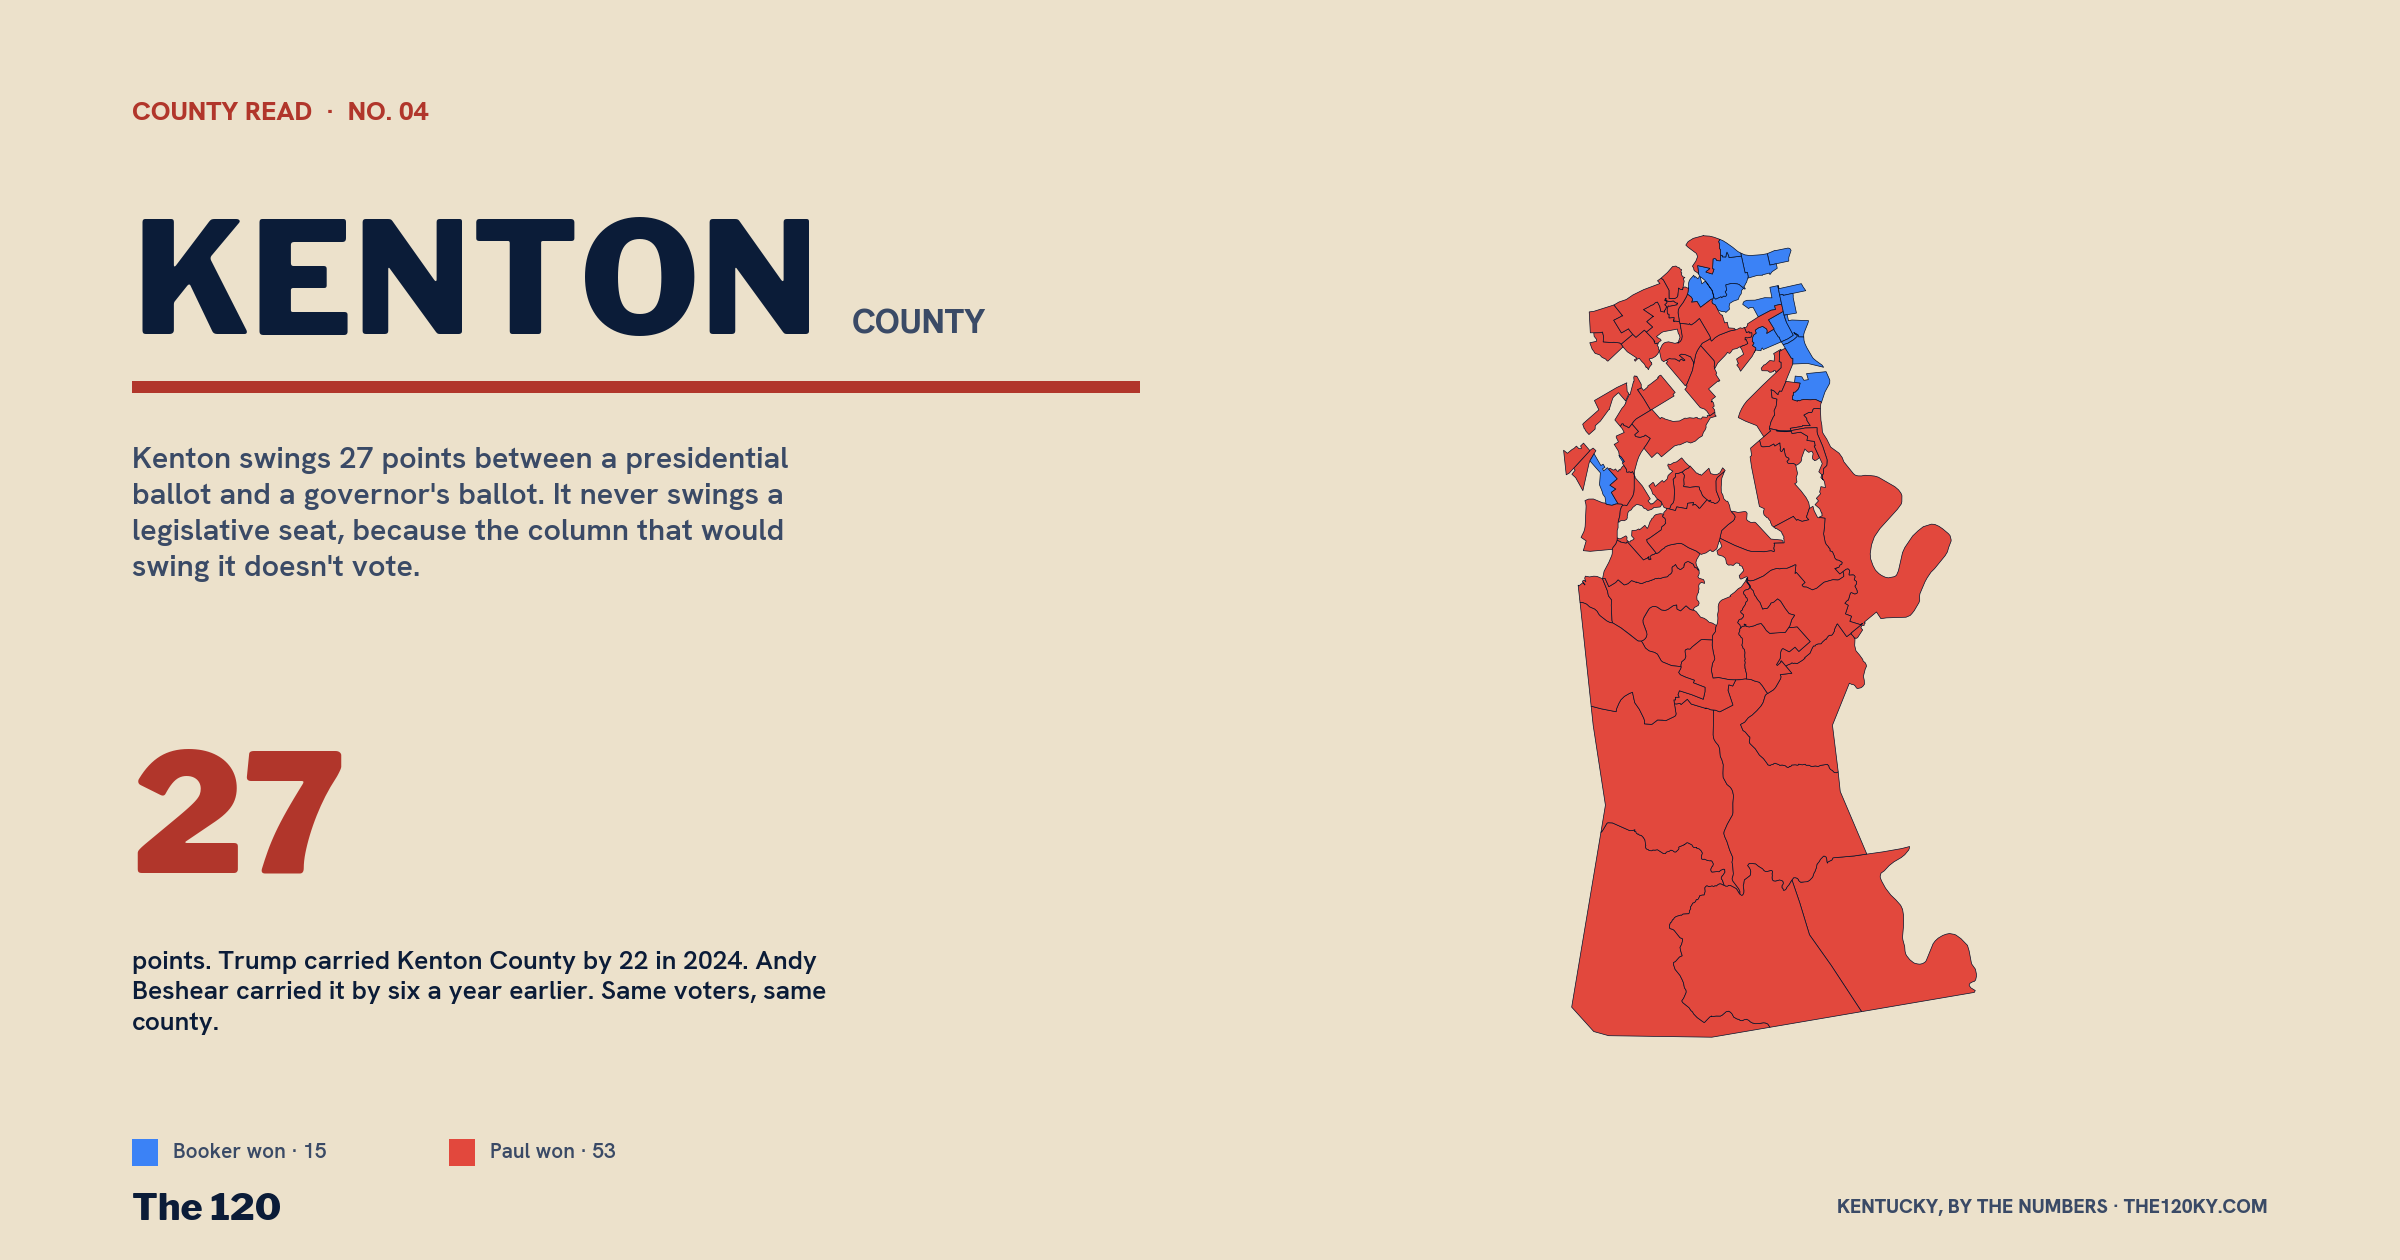
Where it happens. Here's where I have to tell you what I can't show you. Kenton County renumbered its precincts after the 2023 election, and the 2024 returns don't line up with the precinct map I have — only 23 of the 71 new precincts match a boundary in the file. The 2023 governor's race is in the file at the county level only. So the three-election precinct test I've run everywhere else can't run here. What I can draw is the last election that fits the map: the 2022 Senate race, Booker against Paul, on 68 of 71 precincts.
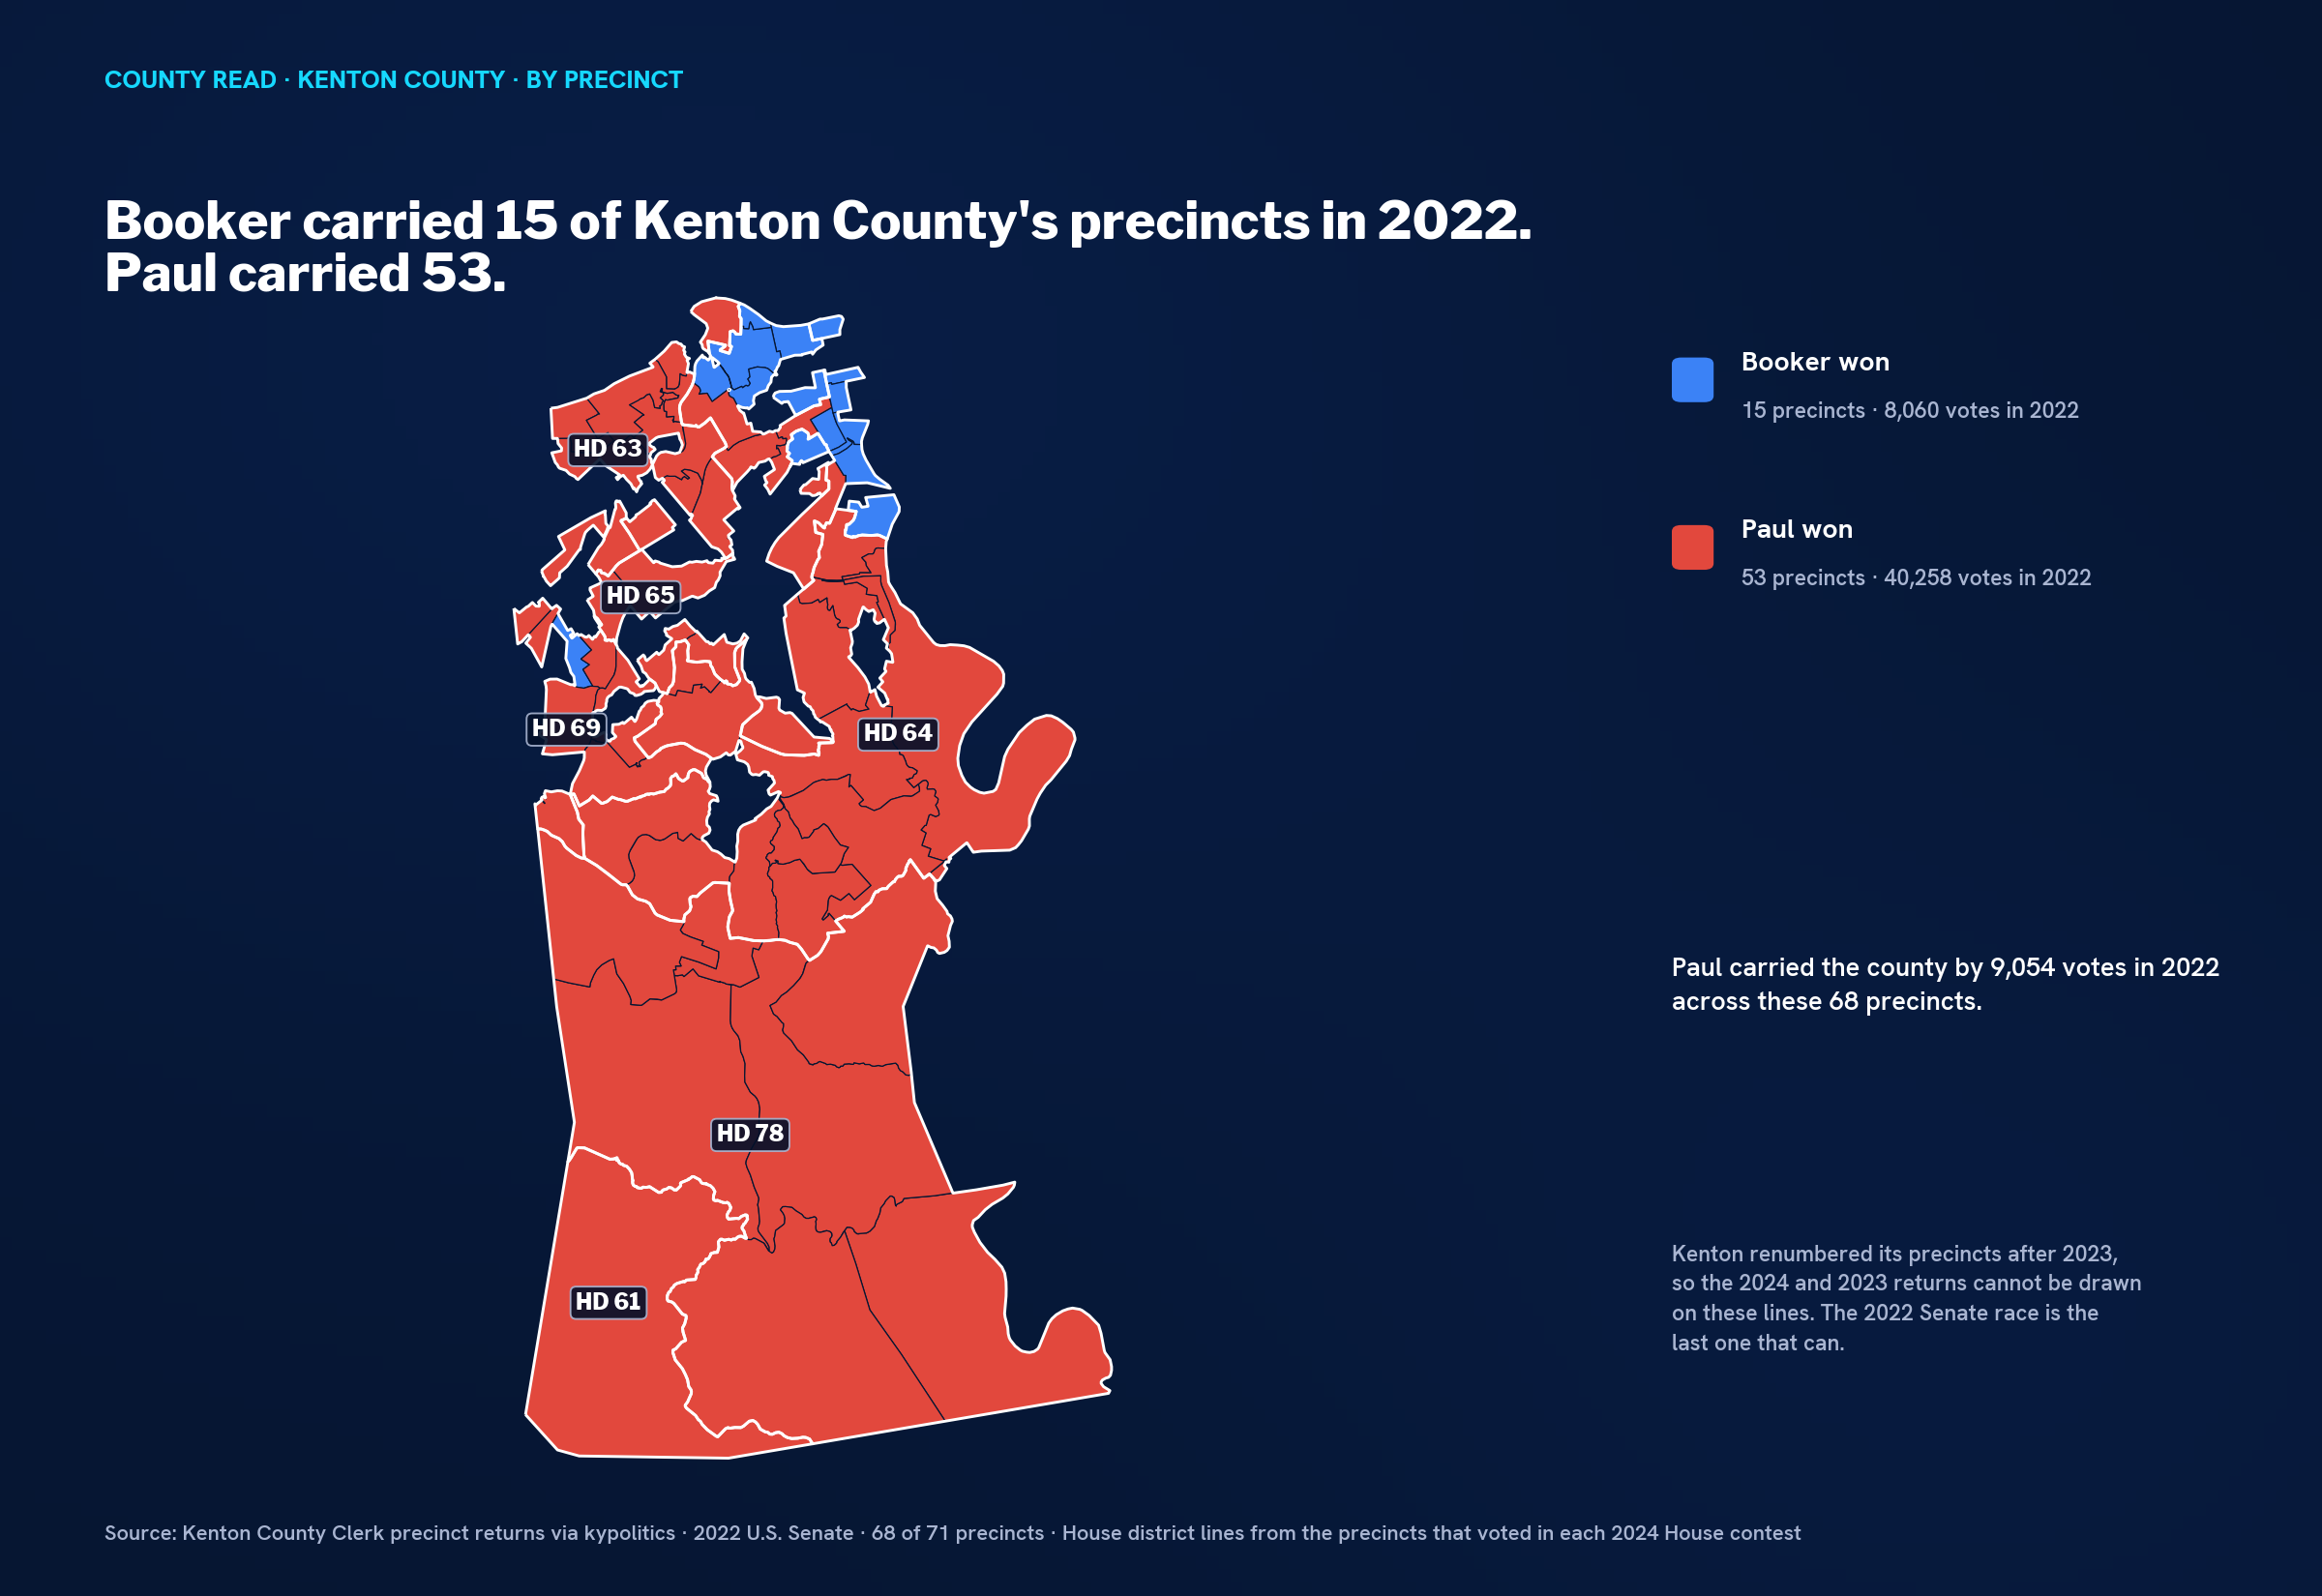
Booker carried 15 precincts, in and around Covington — 8,060 votes. Paul carried 53, nearly everything else, 40,258 votes, and won the county by 9,054 across the 68. That's the shape: a Democratic core in the old river city that's small, and a Republican suburb that runs all the way to the Boone and Grant County lines and casts five votes for every one the core does. In 2022 Booker's fifteen precincts were the whole Democratic map in the county, and nine of them sit in one House district, the 65th. When the county publishes its 2024 precinct file on the new lines, I'll run the real test here. Until then, the 2022 map is the honest one.
What's on the ballot, and who's paying. Six House districts touch Kenton and two Senate districts. Five of the eight have a Democrat.
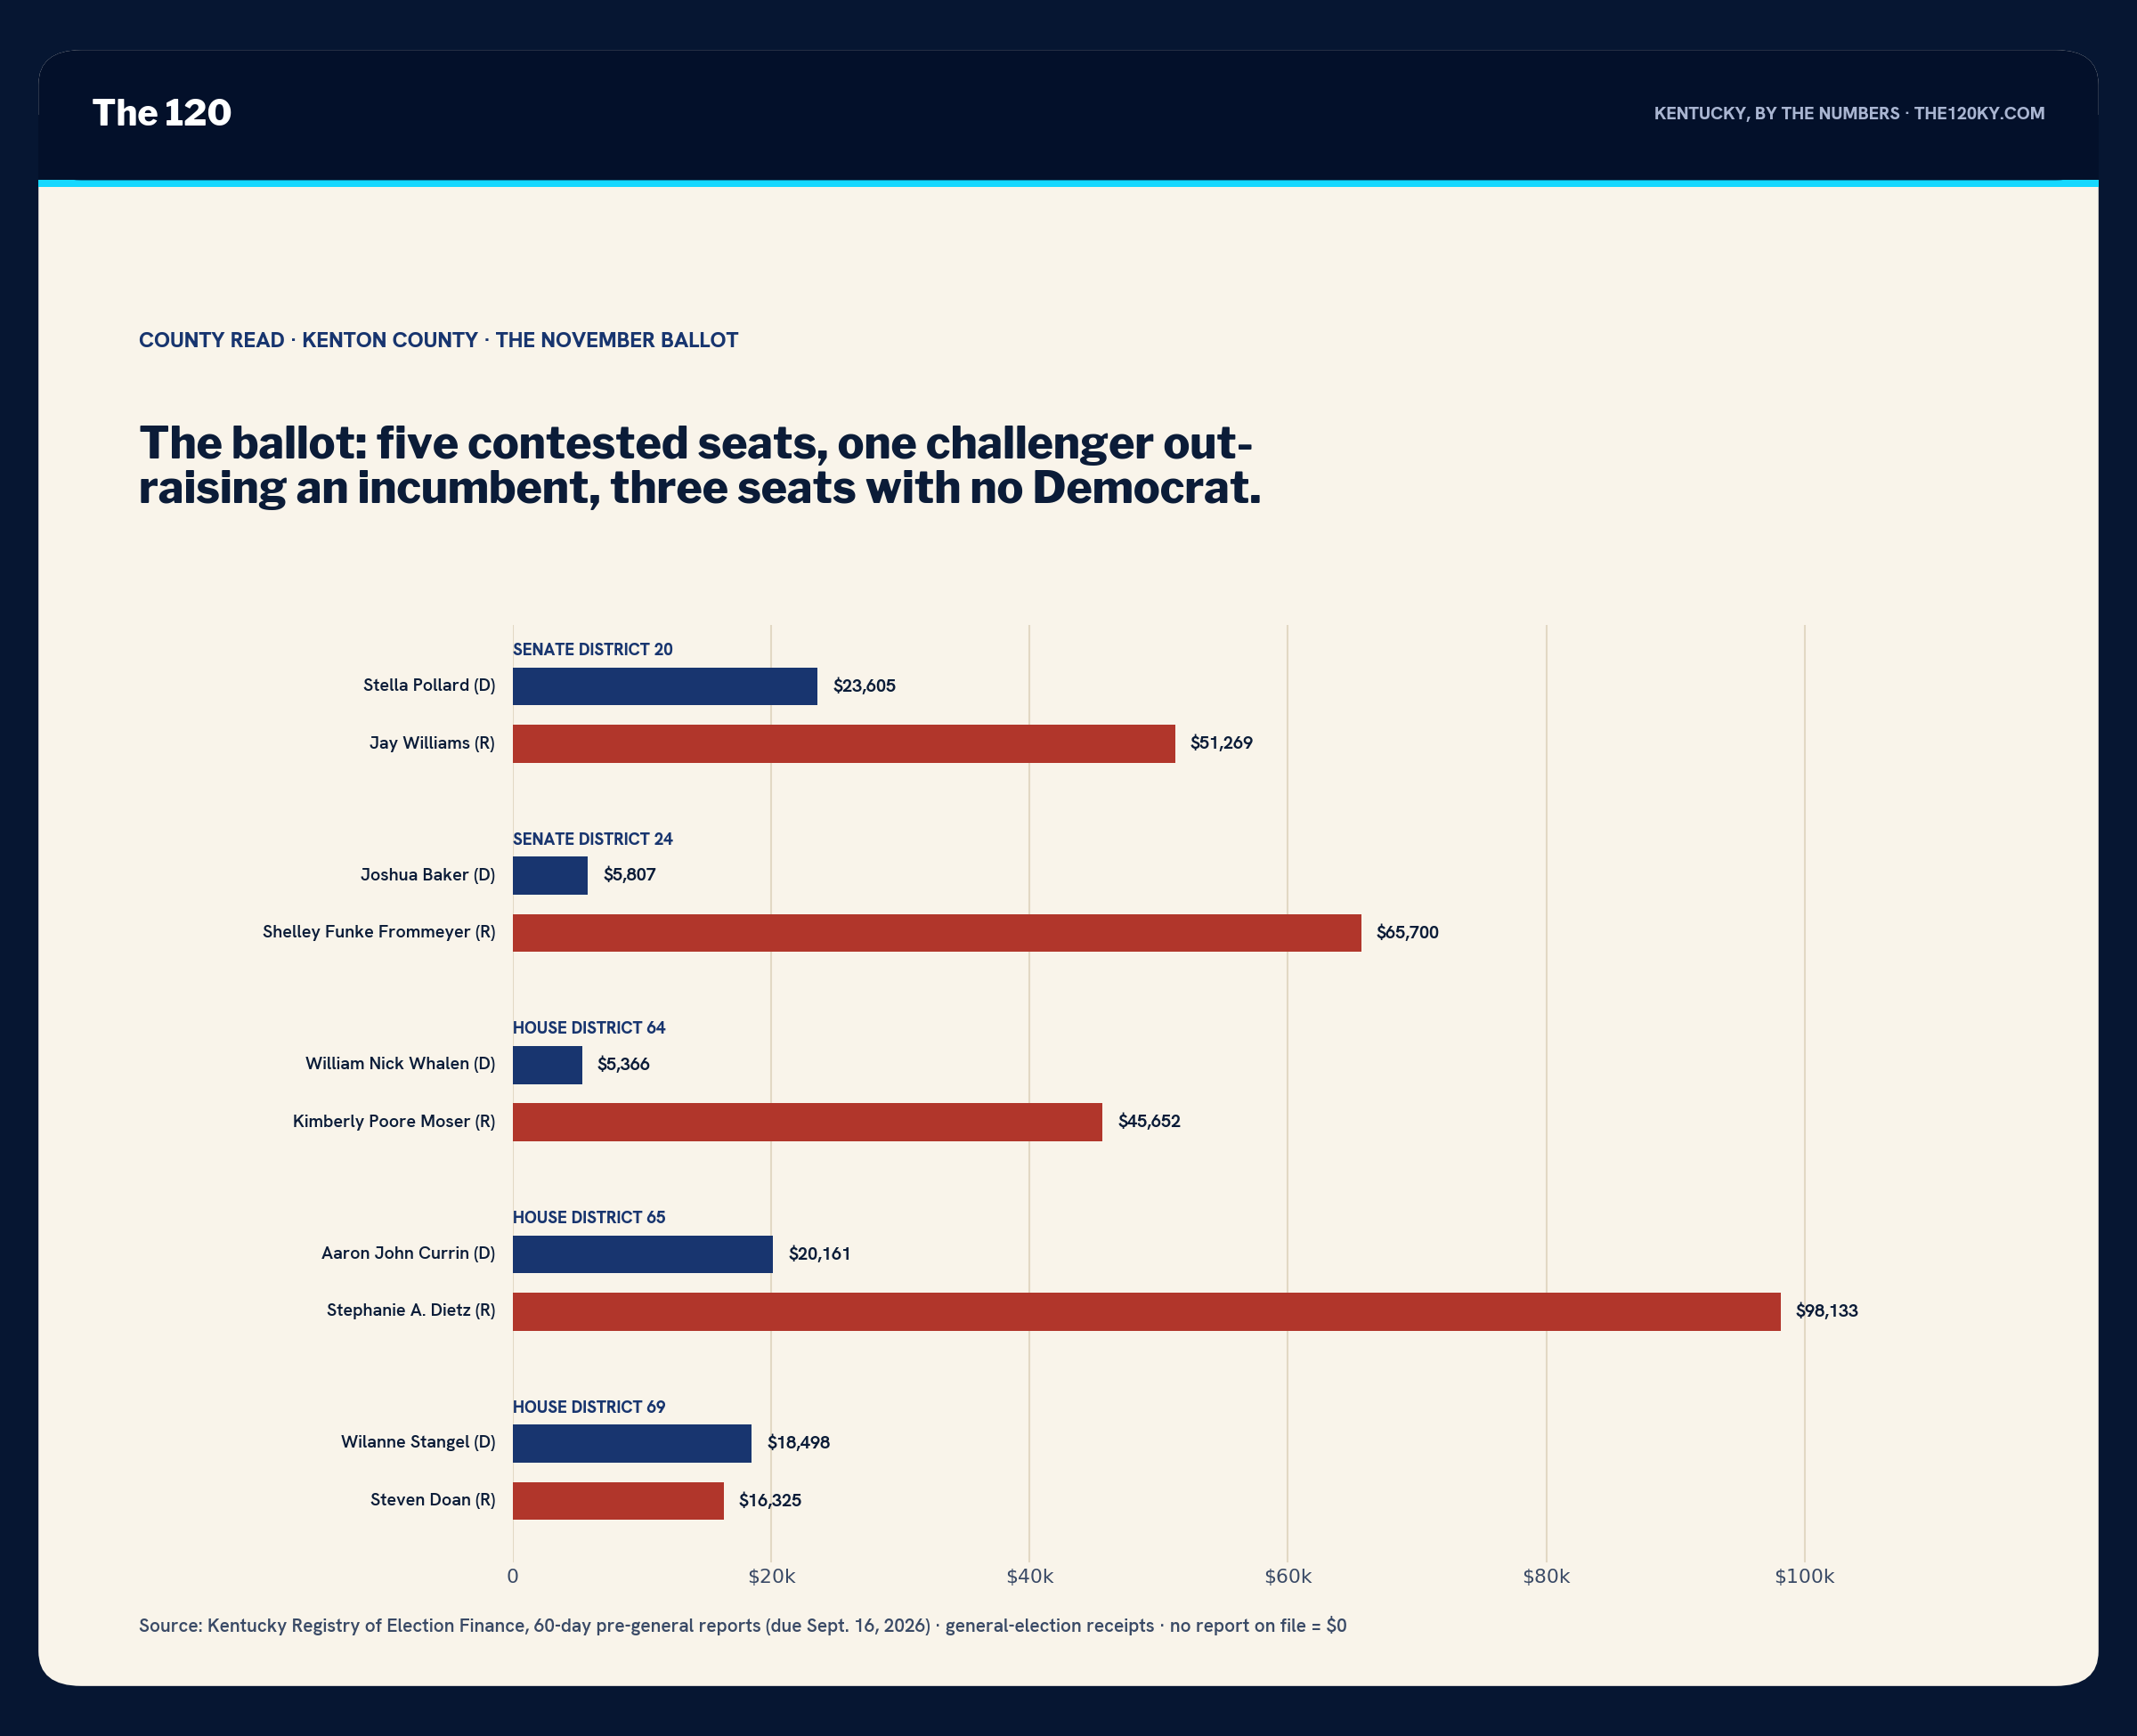
The 65th is Covington, and it's the seat. Stephanie Dietz won it 51–49 in 2022 against Buddy Wheatley and 56–44 in 2024 against Aaron Currin, in a district Trump carried by 5.5. Currin is back with $20,161 against Dietz's $98,133 — five to one — and the district contains nine of the fifteen precincts Booker carried. I said two weeks ago that the 65th is the seat on this map I'd call a stretch in either kind of year, and the money agrees. It's also the only Democratic ground in the county.
The 69th is the one line I'd flag. Wilanne Stangel, running again against Steven Doan in a district Trump carried by 23, has out-raised him — $18,498 to $16,325. It will not flip the seat. It is the only seat in Northern Kentucky where a Democratic challenger has more money than the Republican incumbent, and it tells you the local party is doing something.
The 64th is Kimberly Poore Moser's, Trump +29, and she has $45,652 against Nick Whalen's $5,366. The 61st, 63rd and 78th — Savannah Maddox, Cole Cuzick, Mark Hart — have no Democrat at all, in districts Trump carried by 60, 19 and 54. The 63rd is the one that should bother somebody: a Trump +19 seat with no Democratic line, in a county Beshear carried.
On the Senate side, both seats are Republican and both are contested: Jay Williams in the 20th, 56.3% in 2022, has $51,269 against Stella Pollard's $23,605, and Shelley Funke Frommeyer in the 24th has $65,700 against Joshua Baker's $5,807.
The read. Kenton is the county where the two things I keep writing about meet. The first is that Kentucky's Republican column votes and its Democratic column doesn't: nowhere is that gap wider than here, eleven points in 2024, and it has never once closed. The second is that the no-party column is the only one that grows, and here it's grown to a sixth of the county and votes at a quarter. Put those together and you get a county that swings 27 points between Trump and Beshear and still elects Republicans to everything below the governor's line, because the voters who swing are the ones who stay home in November when there's no governor to vote for. Whoever figures out how to get Kenton's third column to vote in a midterm changes Northern Kentucky. Nobody on this ballot has the money to try.
What I'm watching in November: the 65th, and one number — the no-party turnout rate in Kenton. It was 26.2% in 2022. If it clears 30, the 27-point swing starts showing up downballot. If it doesn't, the map stays 6–0.
Tomorrow: Boone.
Disclosure: I work in Kentucky Democratic politics and consult campaigns in this state. I have no client relationship with any candidate named above. I read this county the same way whether or not it's good news for my side — that's the job. Registration is the Secretary of State's county reports, 2010 through August 2026. Results and turnout by column are the county clerk's certified returns and the Secretary of State's post-election turnout reports via kypolitics. Kenton County renumbered its precincts after 2023; the precinct map shows the 2022 U.S. Senate race on 68 of the 71 precincts of that vintage, and the 2023 and 2024 figures in this piece are county-level and district-level certified totals. House district lines are drawn from the precincts that voted in each 2024 House contest where the codes match. Money is from the Kentucky Registry of Election Finance's 60-day pre-general reports, due September 16. Candidate filings are the Secretary of State's 2026 general election list.