County Read No. 7 · Hardin County
Hardin County: 175 votes for governor, not a dollar in the close House race
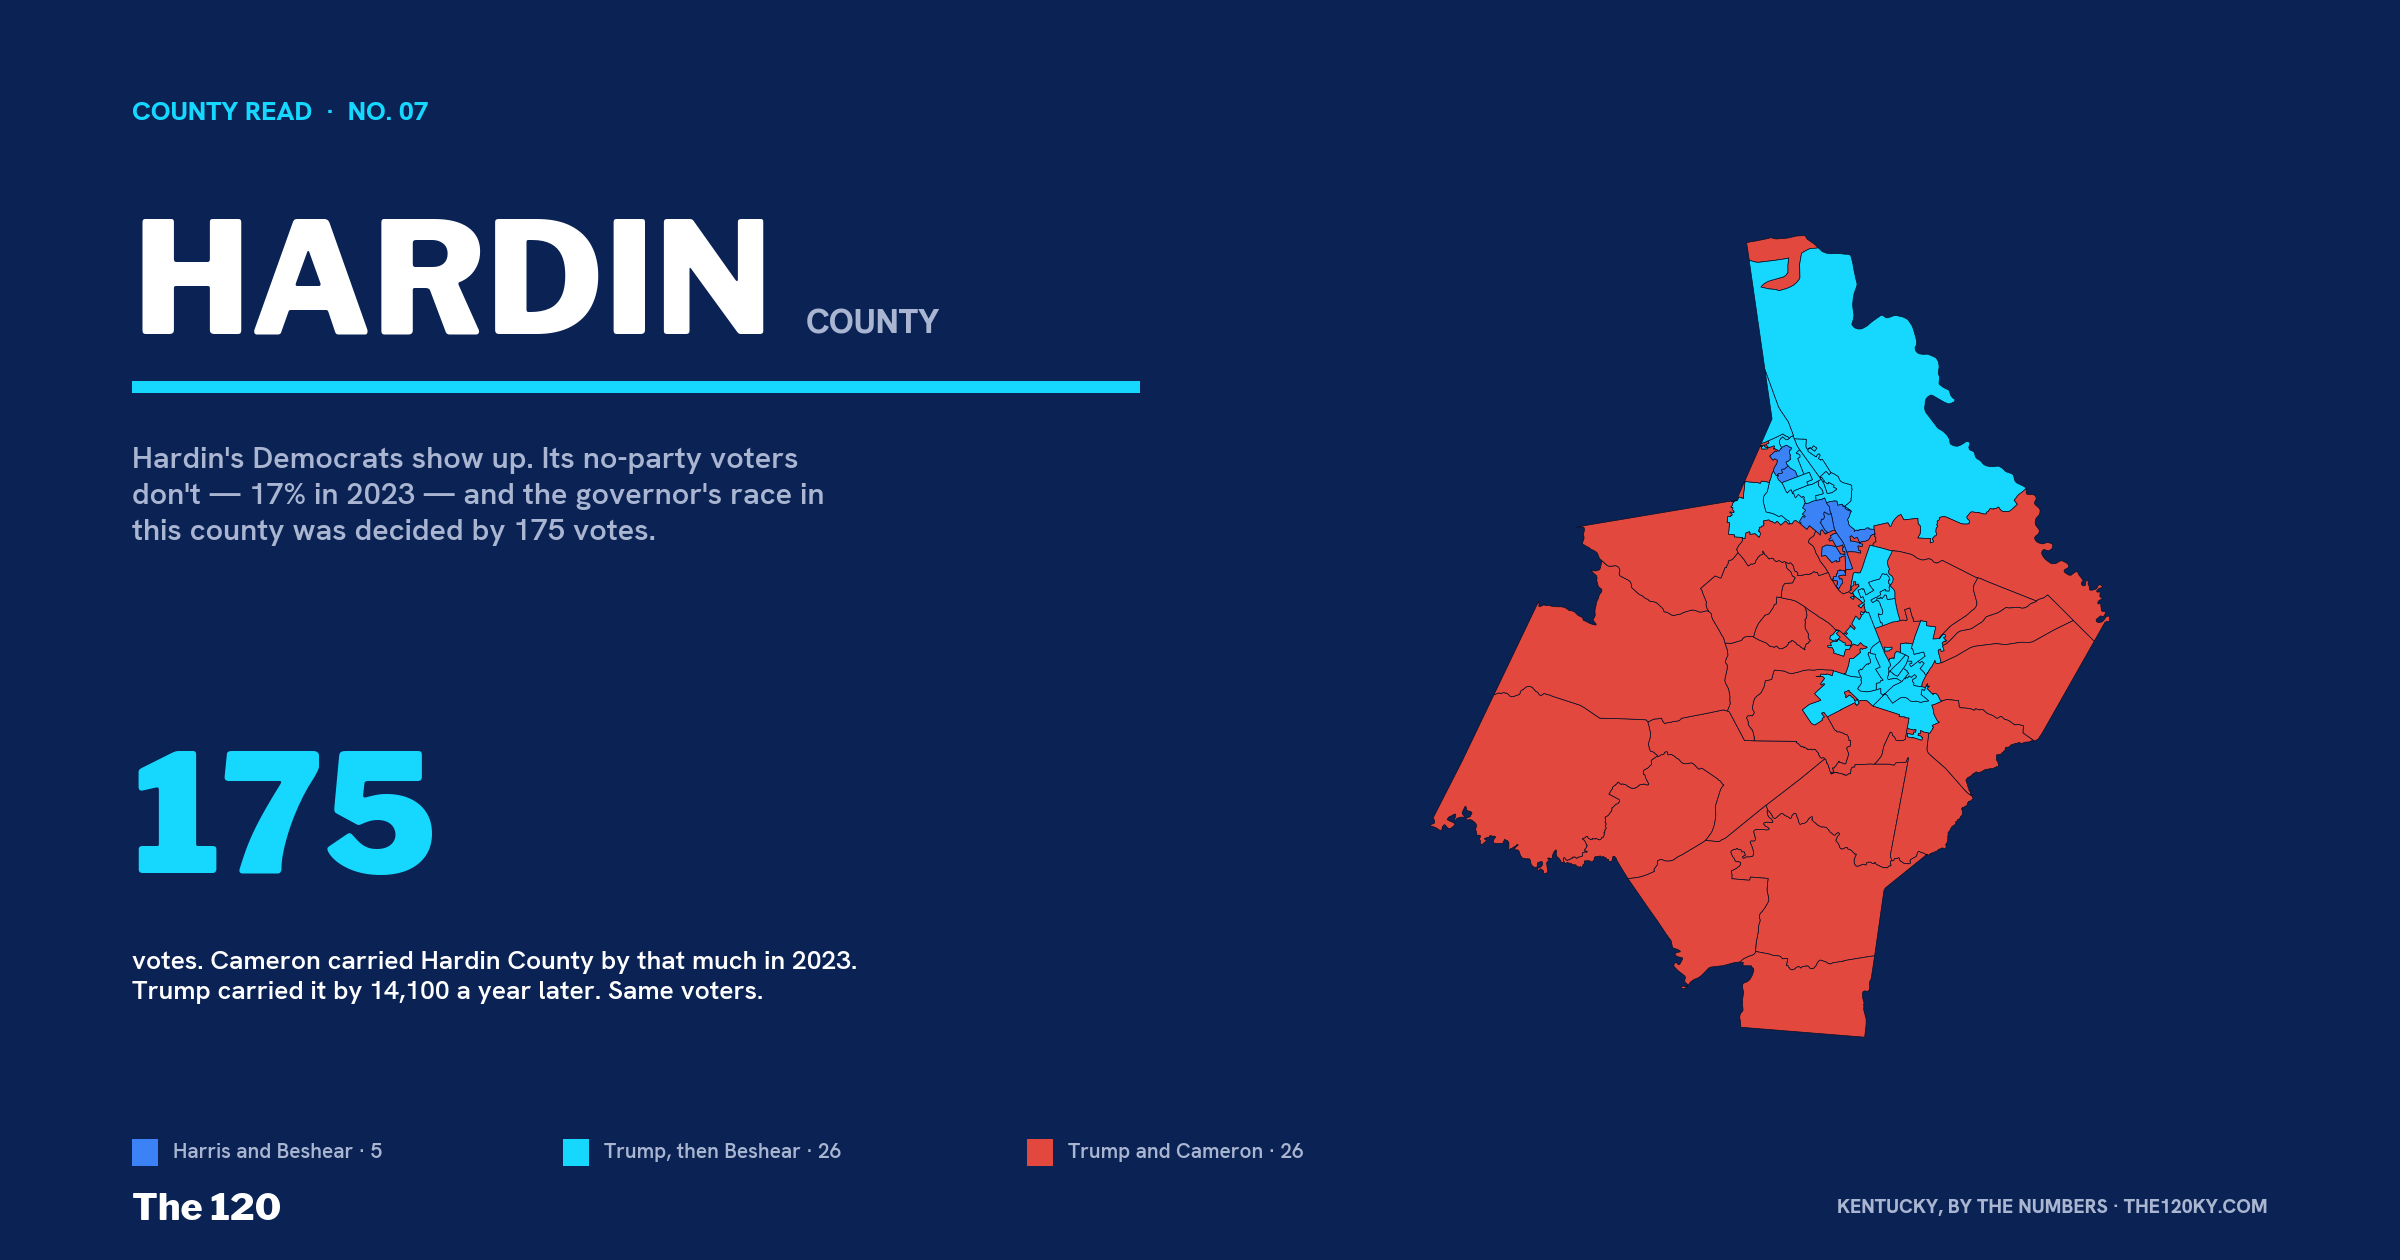
Elizabethtown and Fort Knox. Cameron carried Hardin by 175 votes in 2023; Trump carried it by 14,100 a year later. Twenty-six of its 58 precincts flipped between the two. The reason none of that reaches a legislative seat: the no-party column is one in seven voters and turned out at 17% in 2023 — the lowest in the series — and the one close race on the ballot is a House seat where neither candidate has reported a dollar.
LOUISVILLE — Seventh of twenty. Hardin is the county in the middle — of the state, of the list, and of every number in this series. Same five questions: the paper, the ballots, the turnout, the map, the money.
What the paper says. Hardin County has 83,039 registered voters on the August file: 32,038 Democrats, 38,843 Republicans, 12,158 in neither column. That's 38.6% Democratic, 46.8% Republican, 14.6% no-party — the fourth-highest no-party share in the state, behind the three Northern Kentucky counties, and Fort Knox is likely a big part of that: soldiers and families who register where they're posted and don't pick a party. In 2010 the county was 53.7% Democratic and 37.5% Republican. Same story as Warren, a little slower: a sixteen-point paper Democratic edge in 2010 is an eight-point Republican one now. The Republican column added 14,700; the Democratic column lost 2,500. The purge took 6,560 names since Election Day 2024, two-thirds of them Democrats.
What the ballots say. The second 29-point swing in two days.
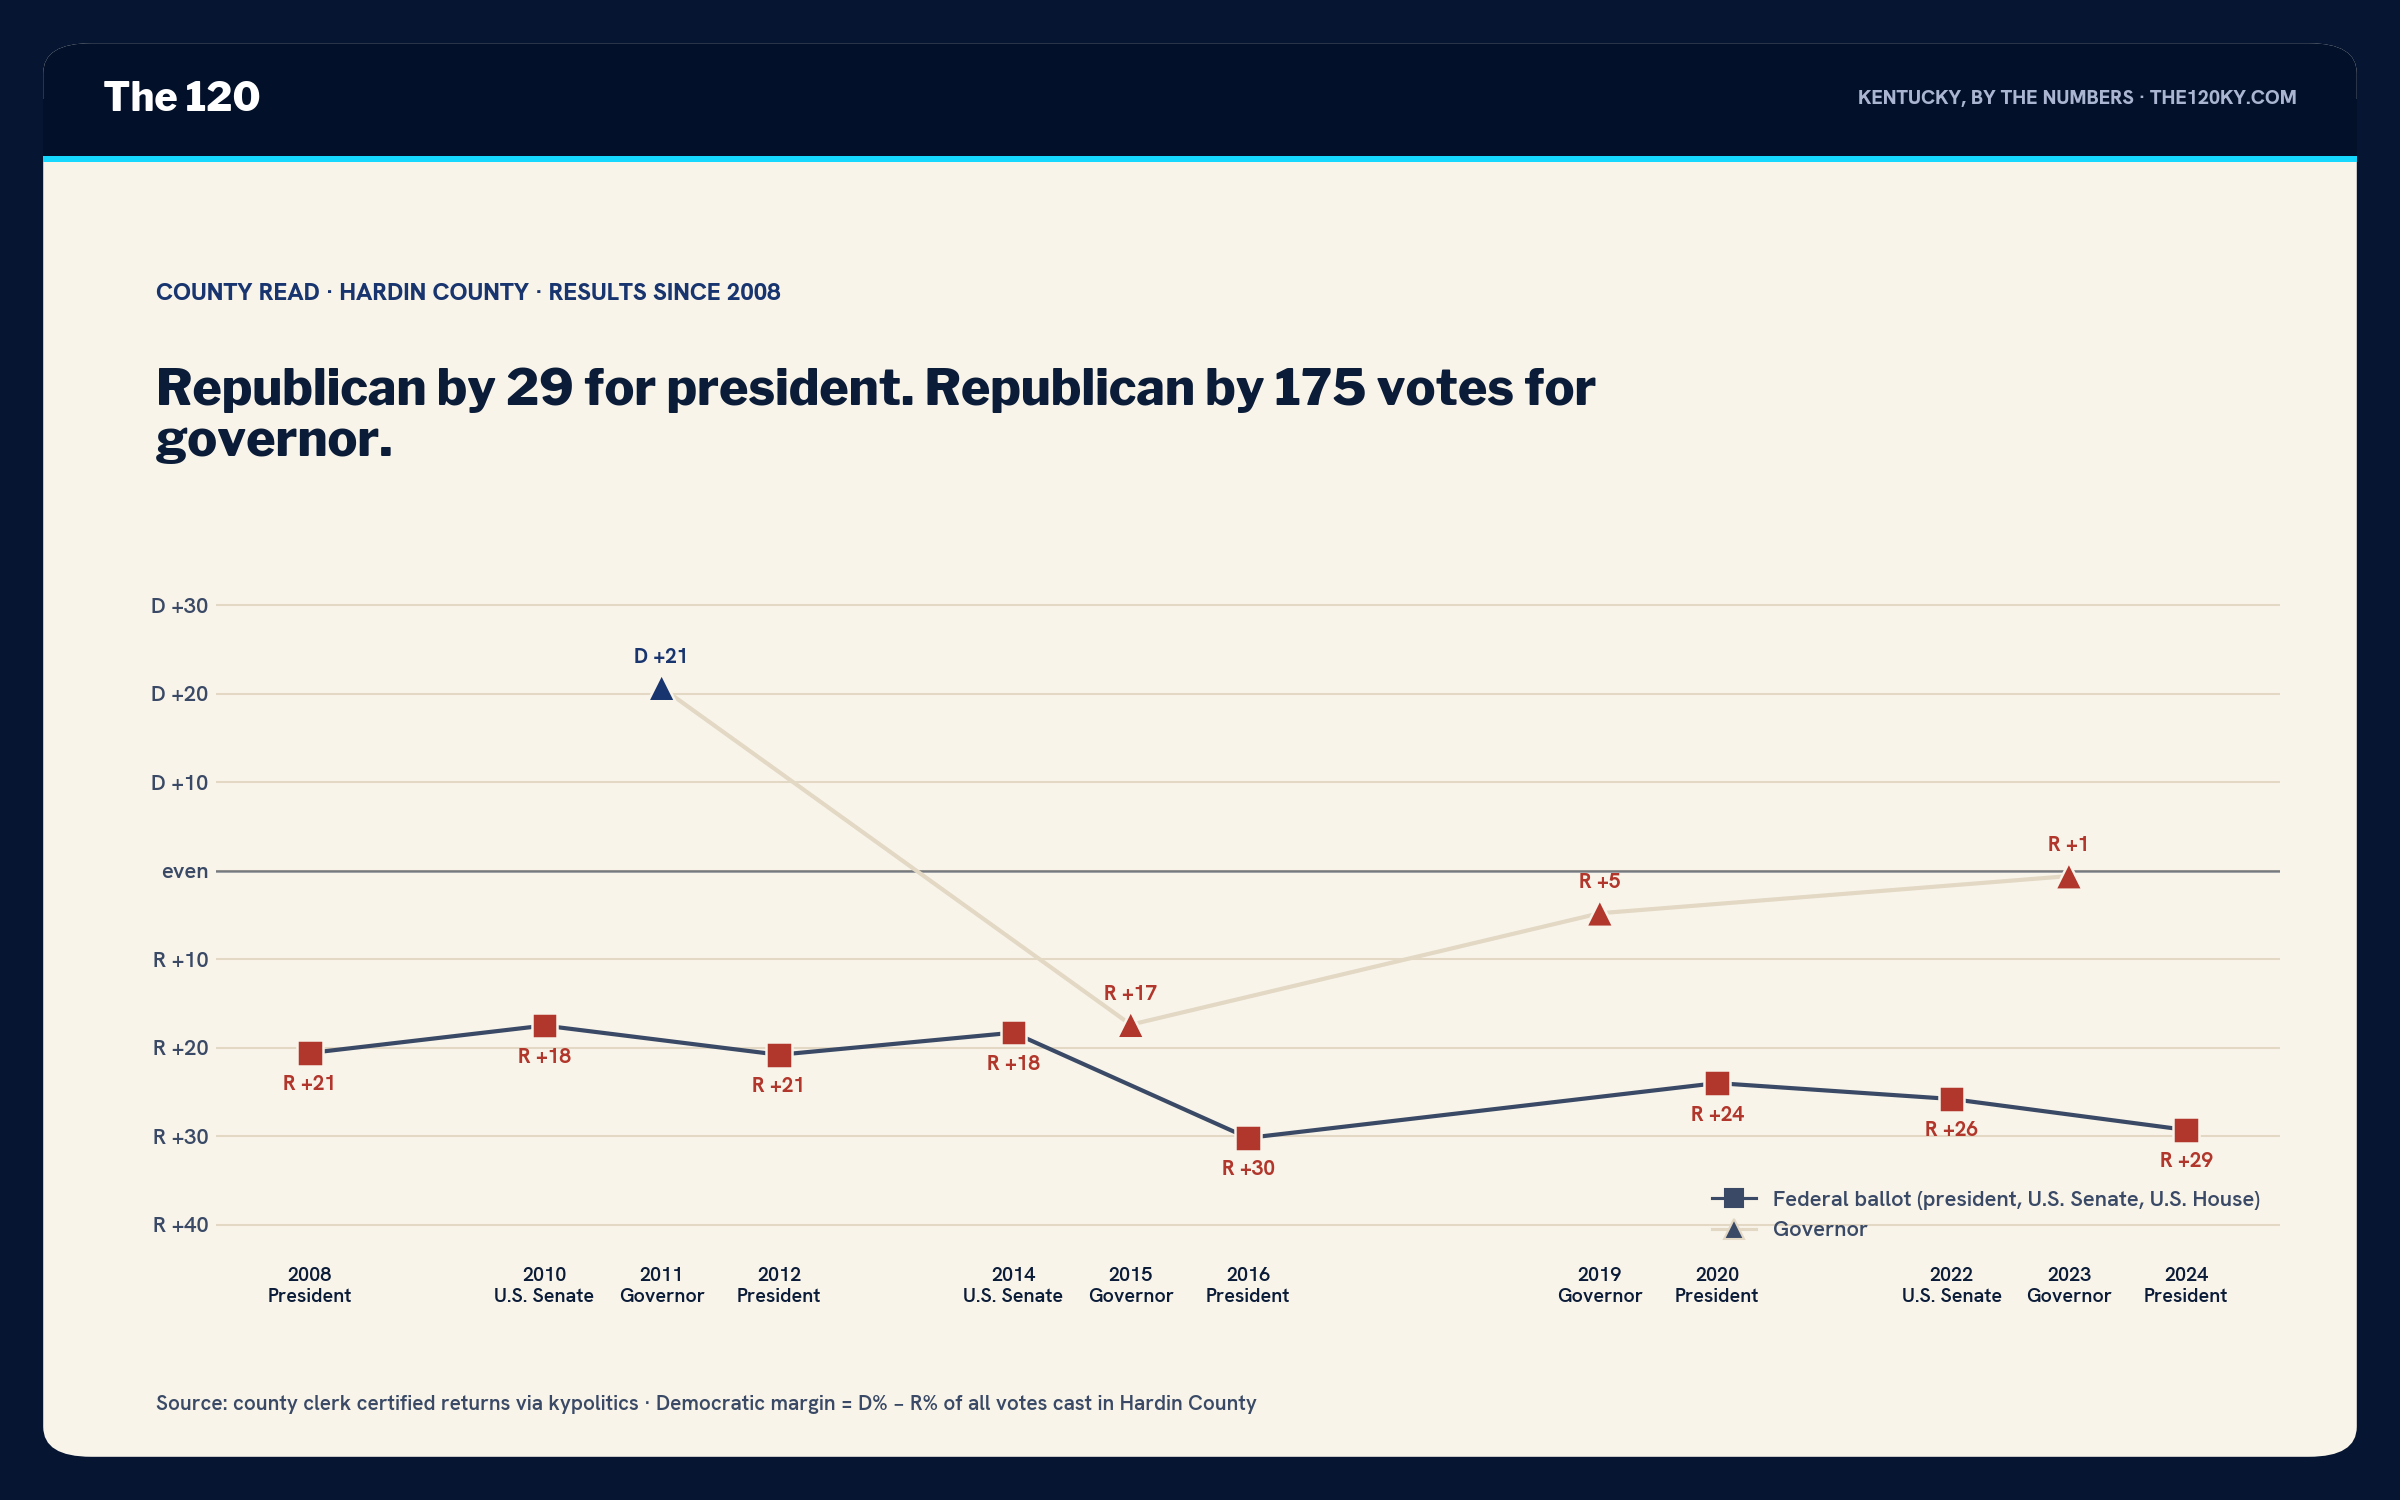
Romney by 21. Trump by 30, then 24, then 29 — 30,672 to 16,572 in 2024, a 14,100-vote margin. And in 2023 Daniel Cameron carried Hardin County by 175 votes: 14,511 to 14,336. That's a 28.7-point swing between consecutive Novembers, a hair past Warren's 28.5 for the widest in the series so far, and unlike Warren it stopped 175 votes short of the line. Beshear got to within a rounding error in a county Trump carries by 29. Nobody else on a Democratic ballot has come within twenty.
Who's turning out. The party gap is the smallest in the series. The third-column gap is the biggest.
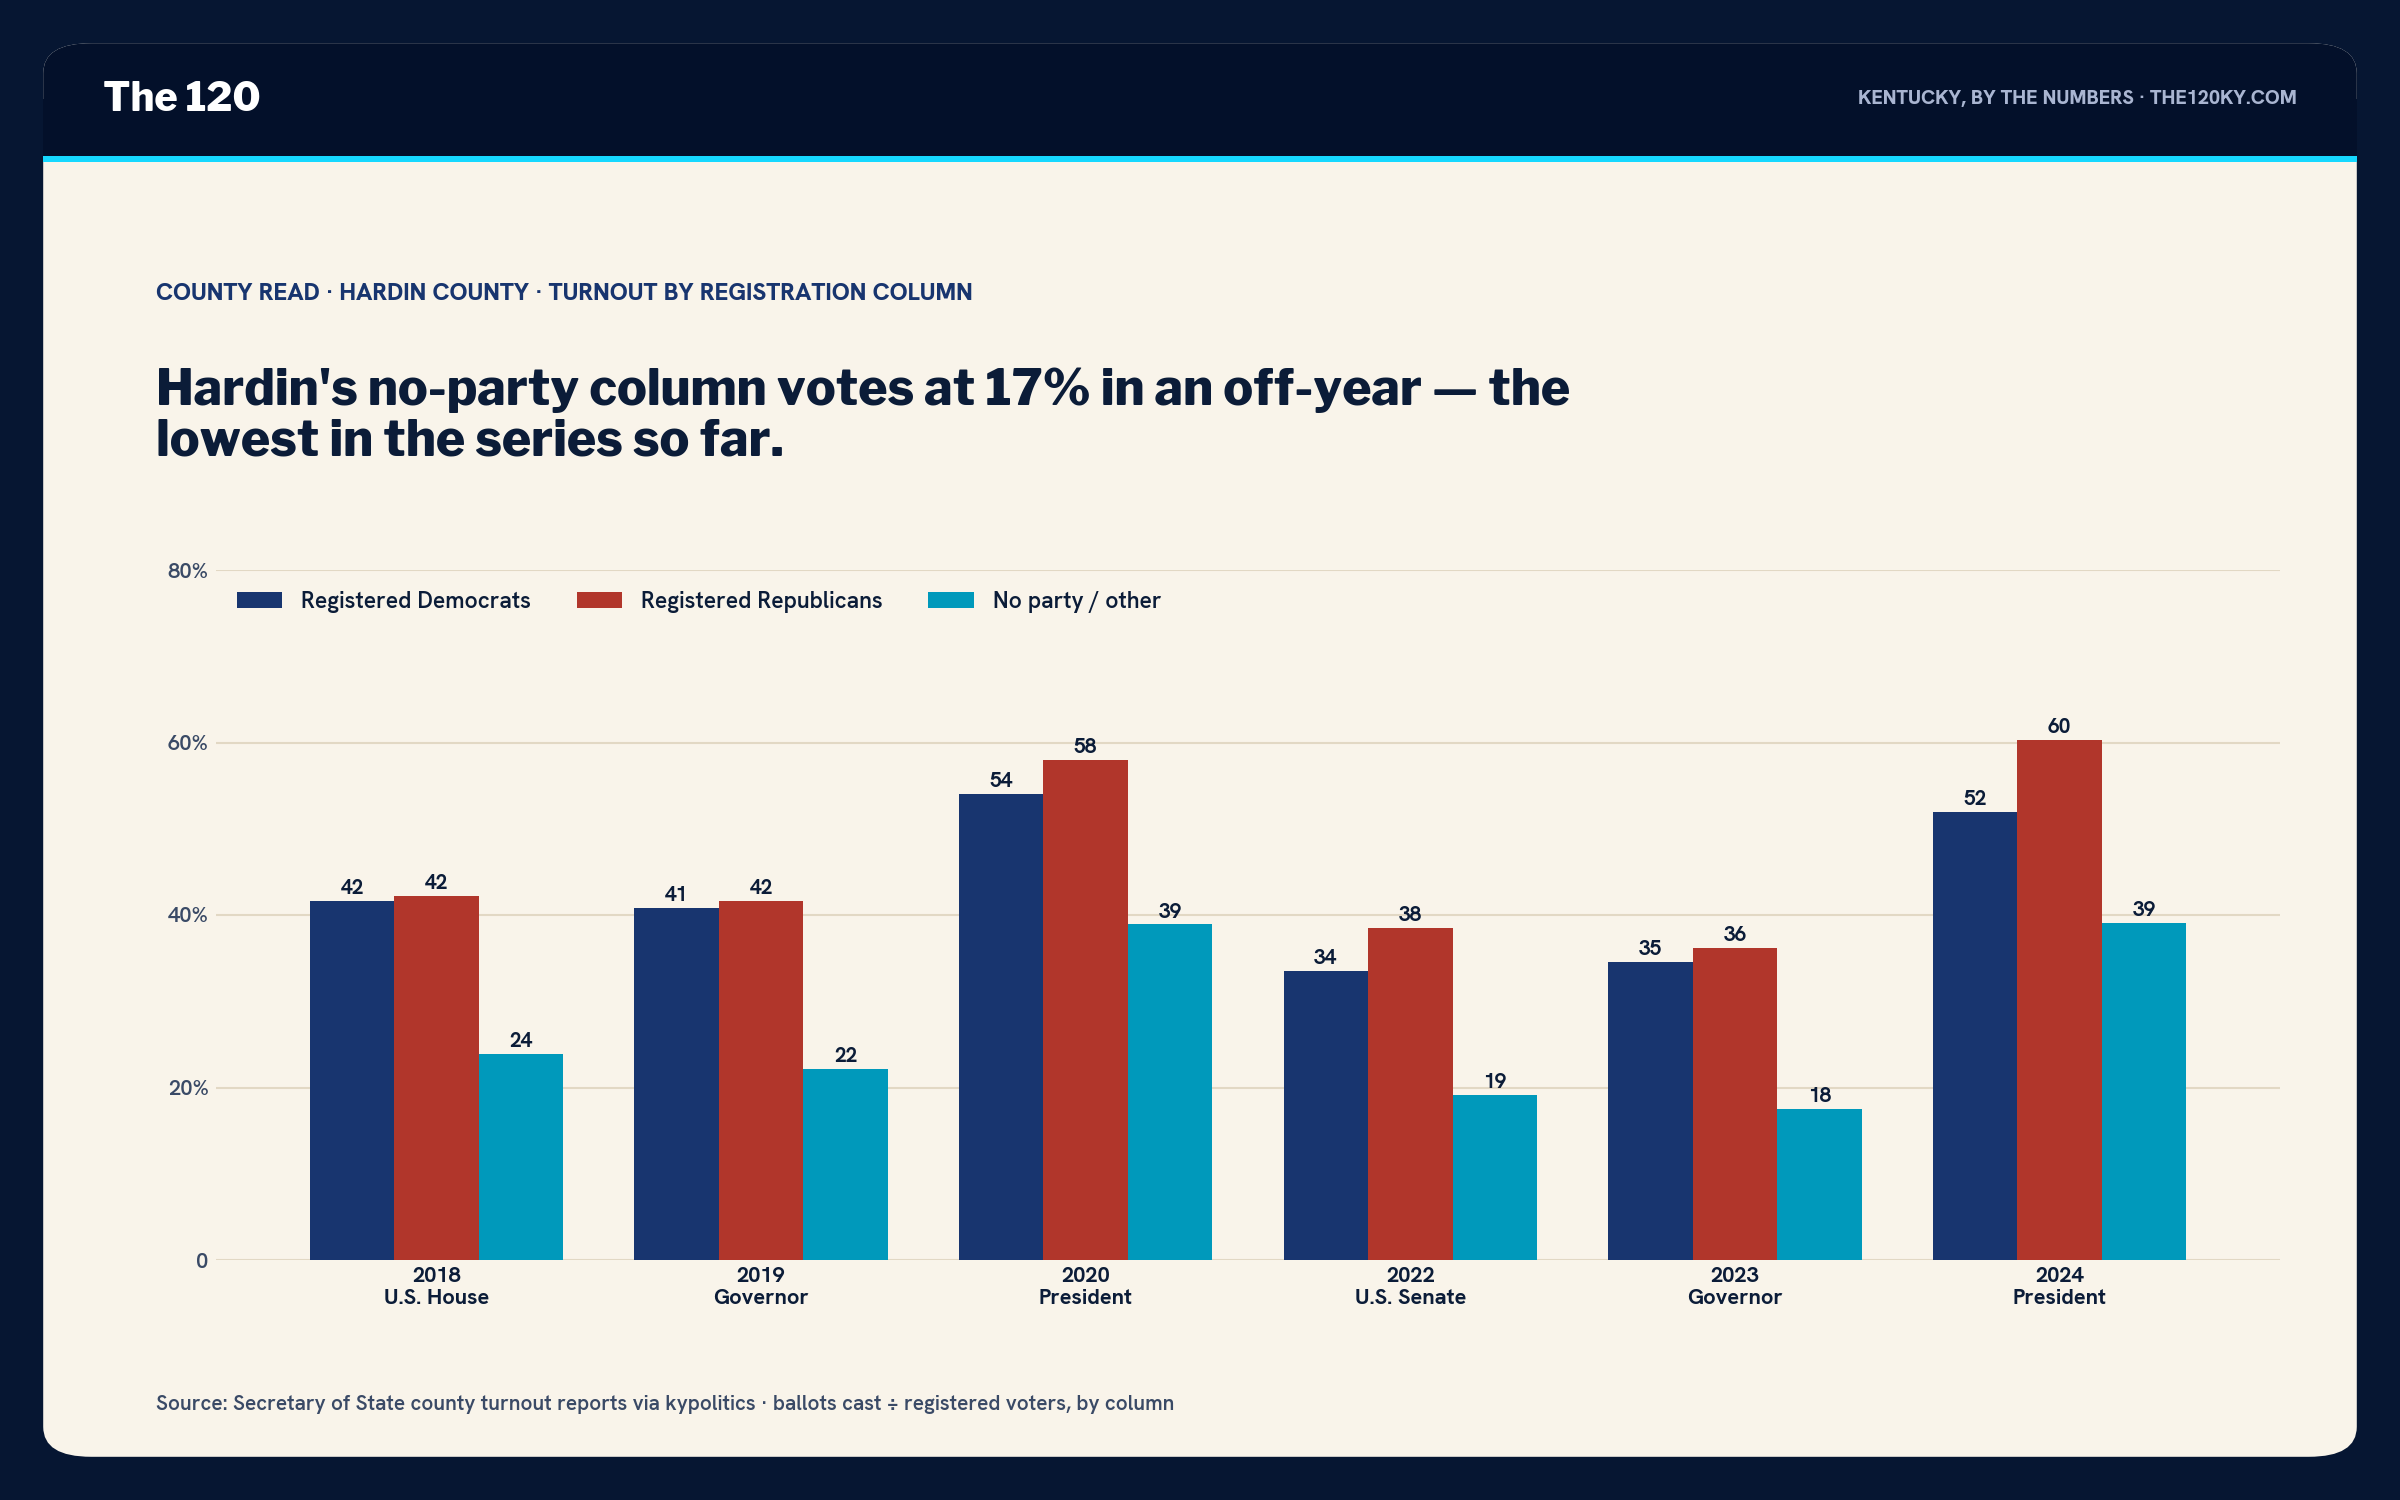
In 2018 Hardin's registered Republicans out-voted its Democrats by six-tenths of a point. In 2019, by eight-tenths. In 2023, by 1.6. Those are the closest turnout margins in any county I've done; the Democratic column here shows up. The gap opens in federal years — five points in 2022, eight in 2024 — which is the same pattern as everywhere, just smaller.
The third column is the story. Hardin's 12,158 no-party voters turned out at 19.1% in 2022 and 17.5% in 2023 — the lowest off-year rates in the series, four points under Warren, six under Kenton. Fort Knox is likely a lot of that: a post population that registers here and votes, if it votes, somewhere else or not at all. At the major-party rate the third column would have cast about 2,200 more ballots in 2023. Cameron won by 175.
Hardin's Democrats show up. Its no-party voters don't — 17% in 2023 — and the governor's race in this county was decided by 175 votes.
Where it happens. Fifty-seven of 58 precincts with both years, and the three-election test splits the county nearly in half.
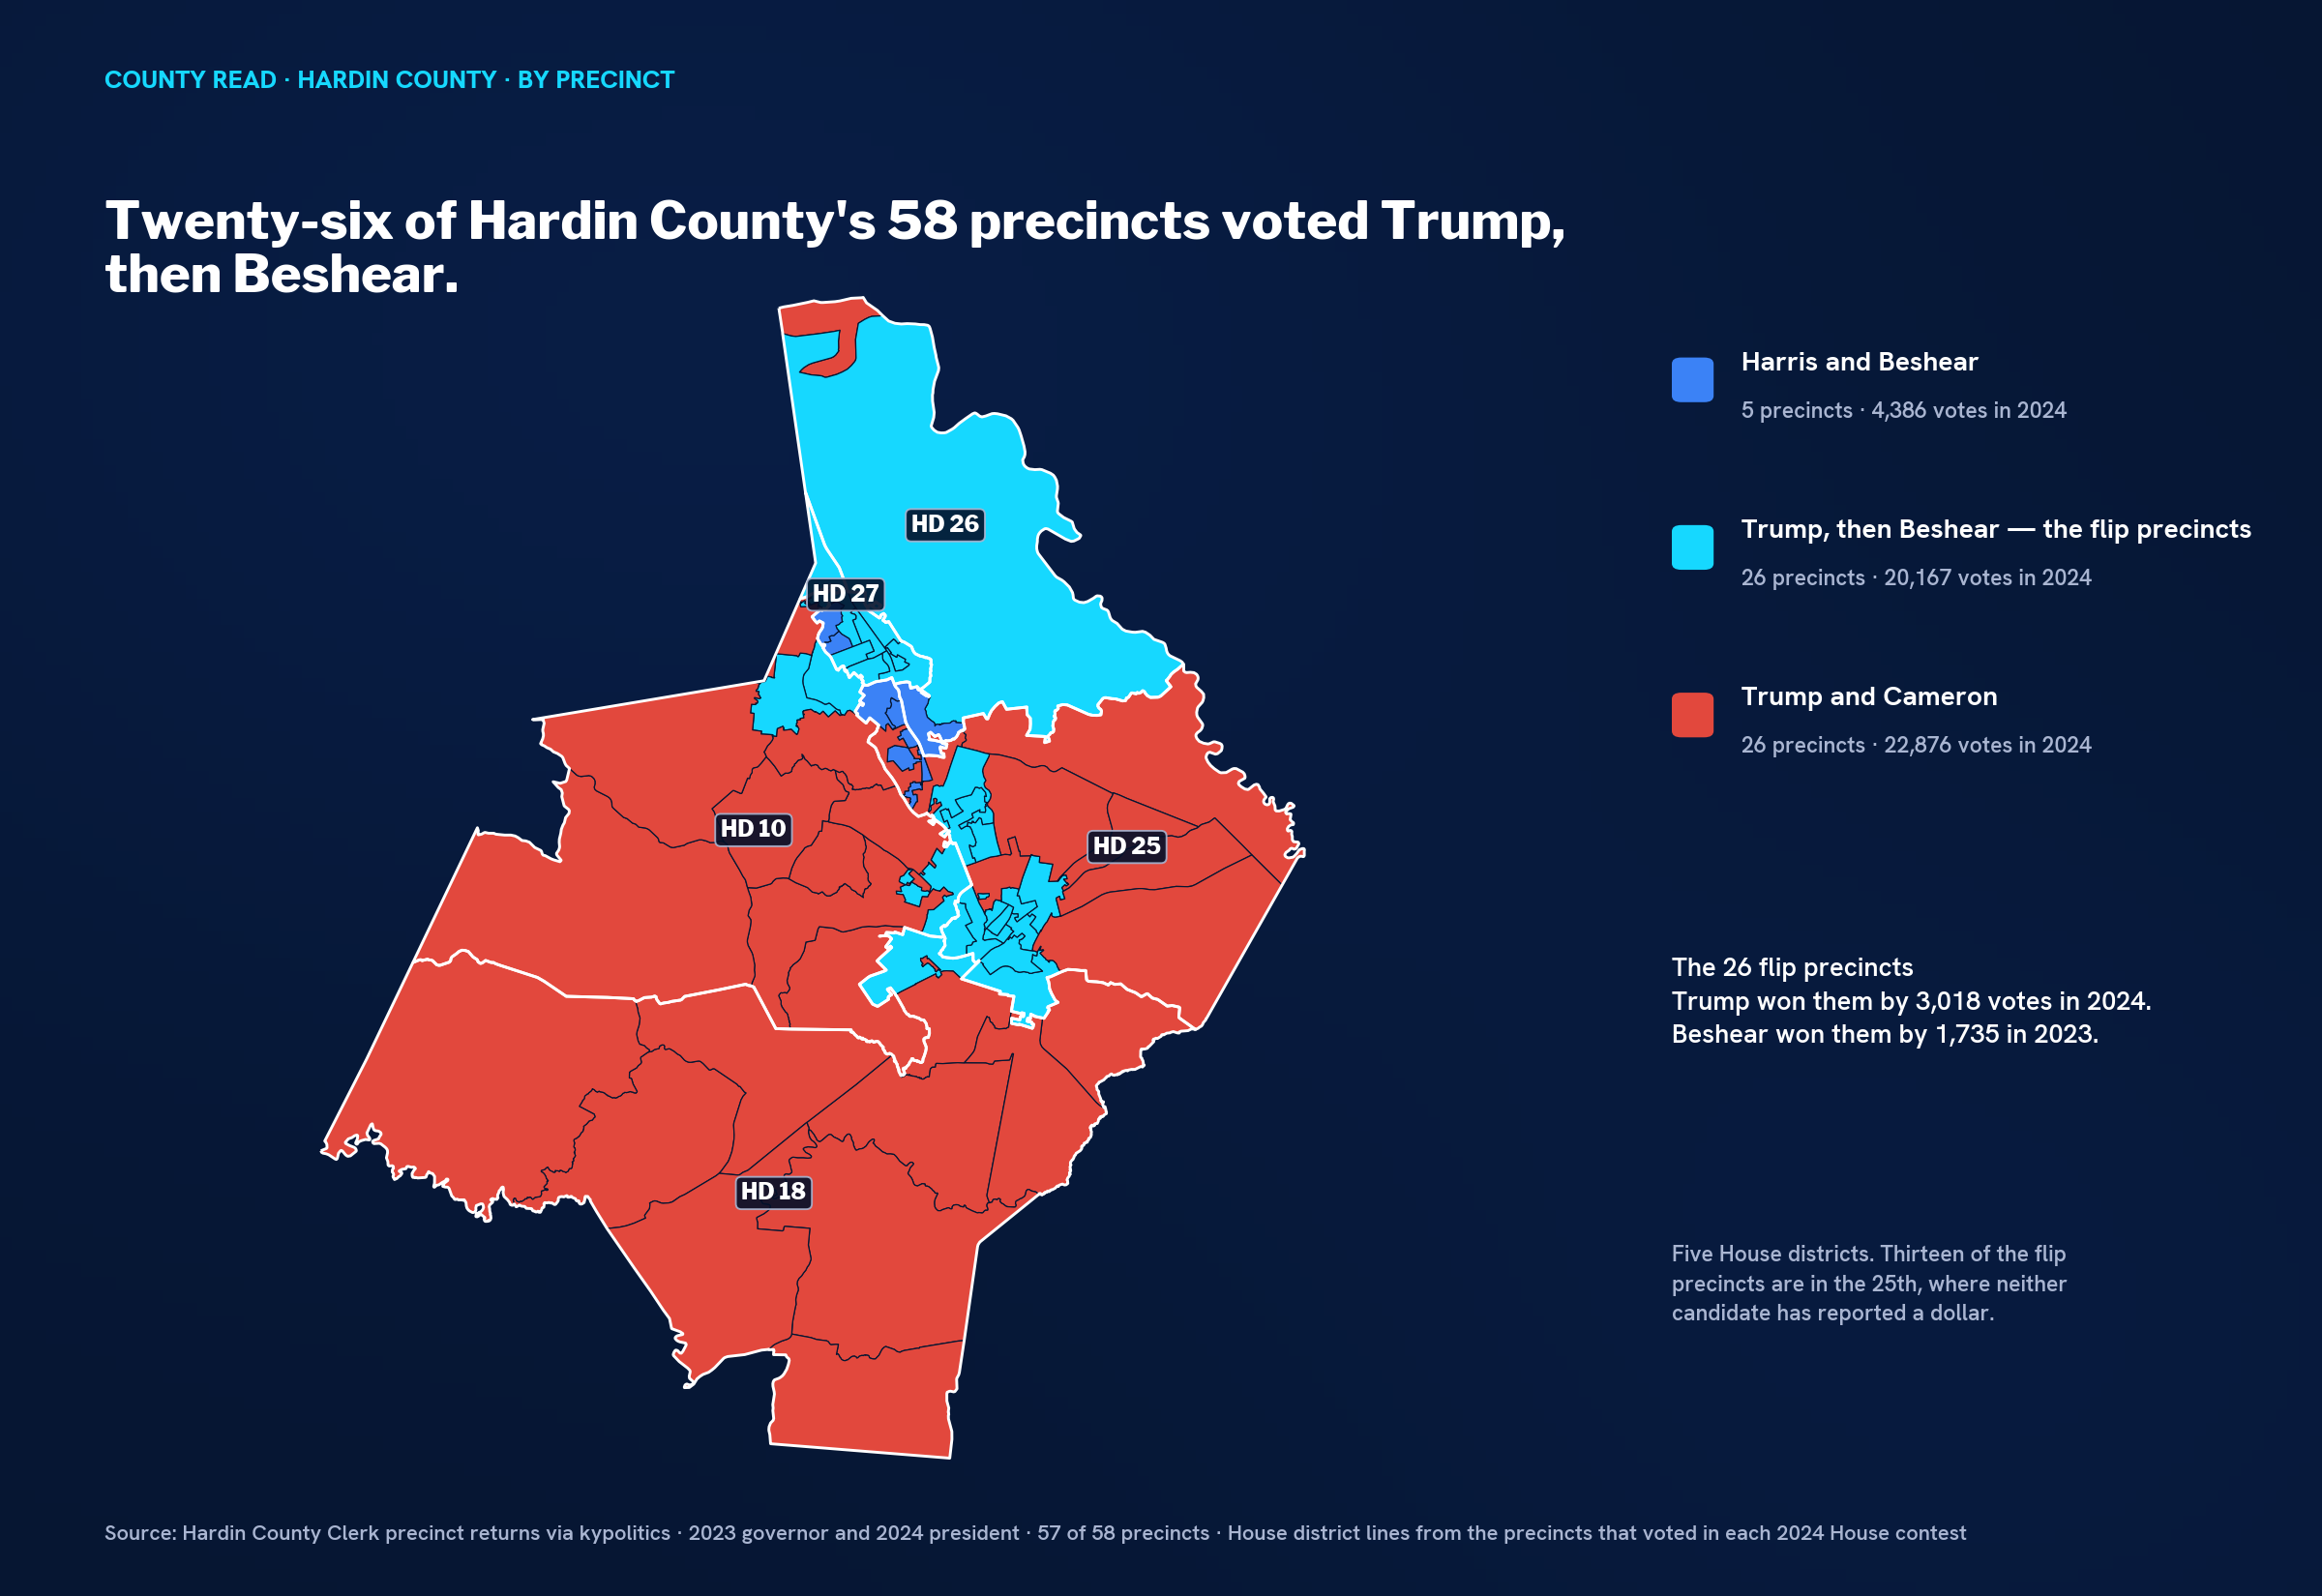
Five precincts voted for Harris and for Beshear — 4,386 votes, Harris by 133, Beshear by 824. Twenty-six voted for Trump and for Cameron: 22,876 votes, Trump by 10,951, Cameron by 2,685. And twenty-six voted for Trump and then for Beshear: 20,167 votes, Trump by 3,018, Beshear by 1,735. That's the north of the county — the 26th and 27th, and most of the 25th — and it's the second-biggest flip share in the series after Louisville: 45% of the county's precincts and 42% of its vote. Thirteen of the 26 flip precincts are in the 25th. Seven are in the 27th, and in the 27th's nine Hardin precincts, Trump won by only 342 and Beshear by 731.
What's on the ballot, and who's paying. Five House districts and one Senate district touch Hardin. Four of the six have a Democrat.
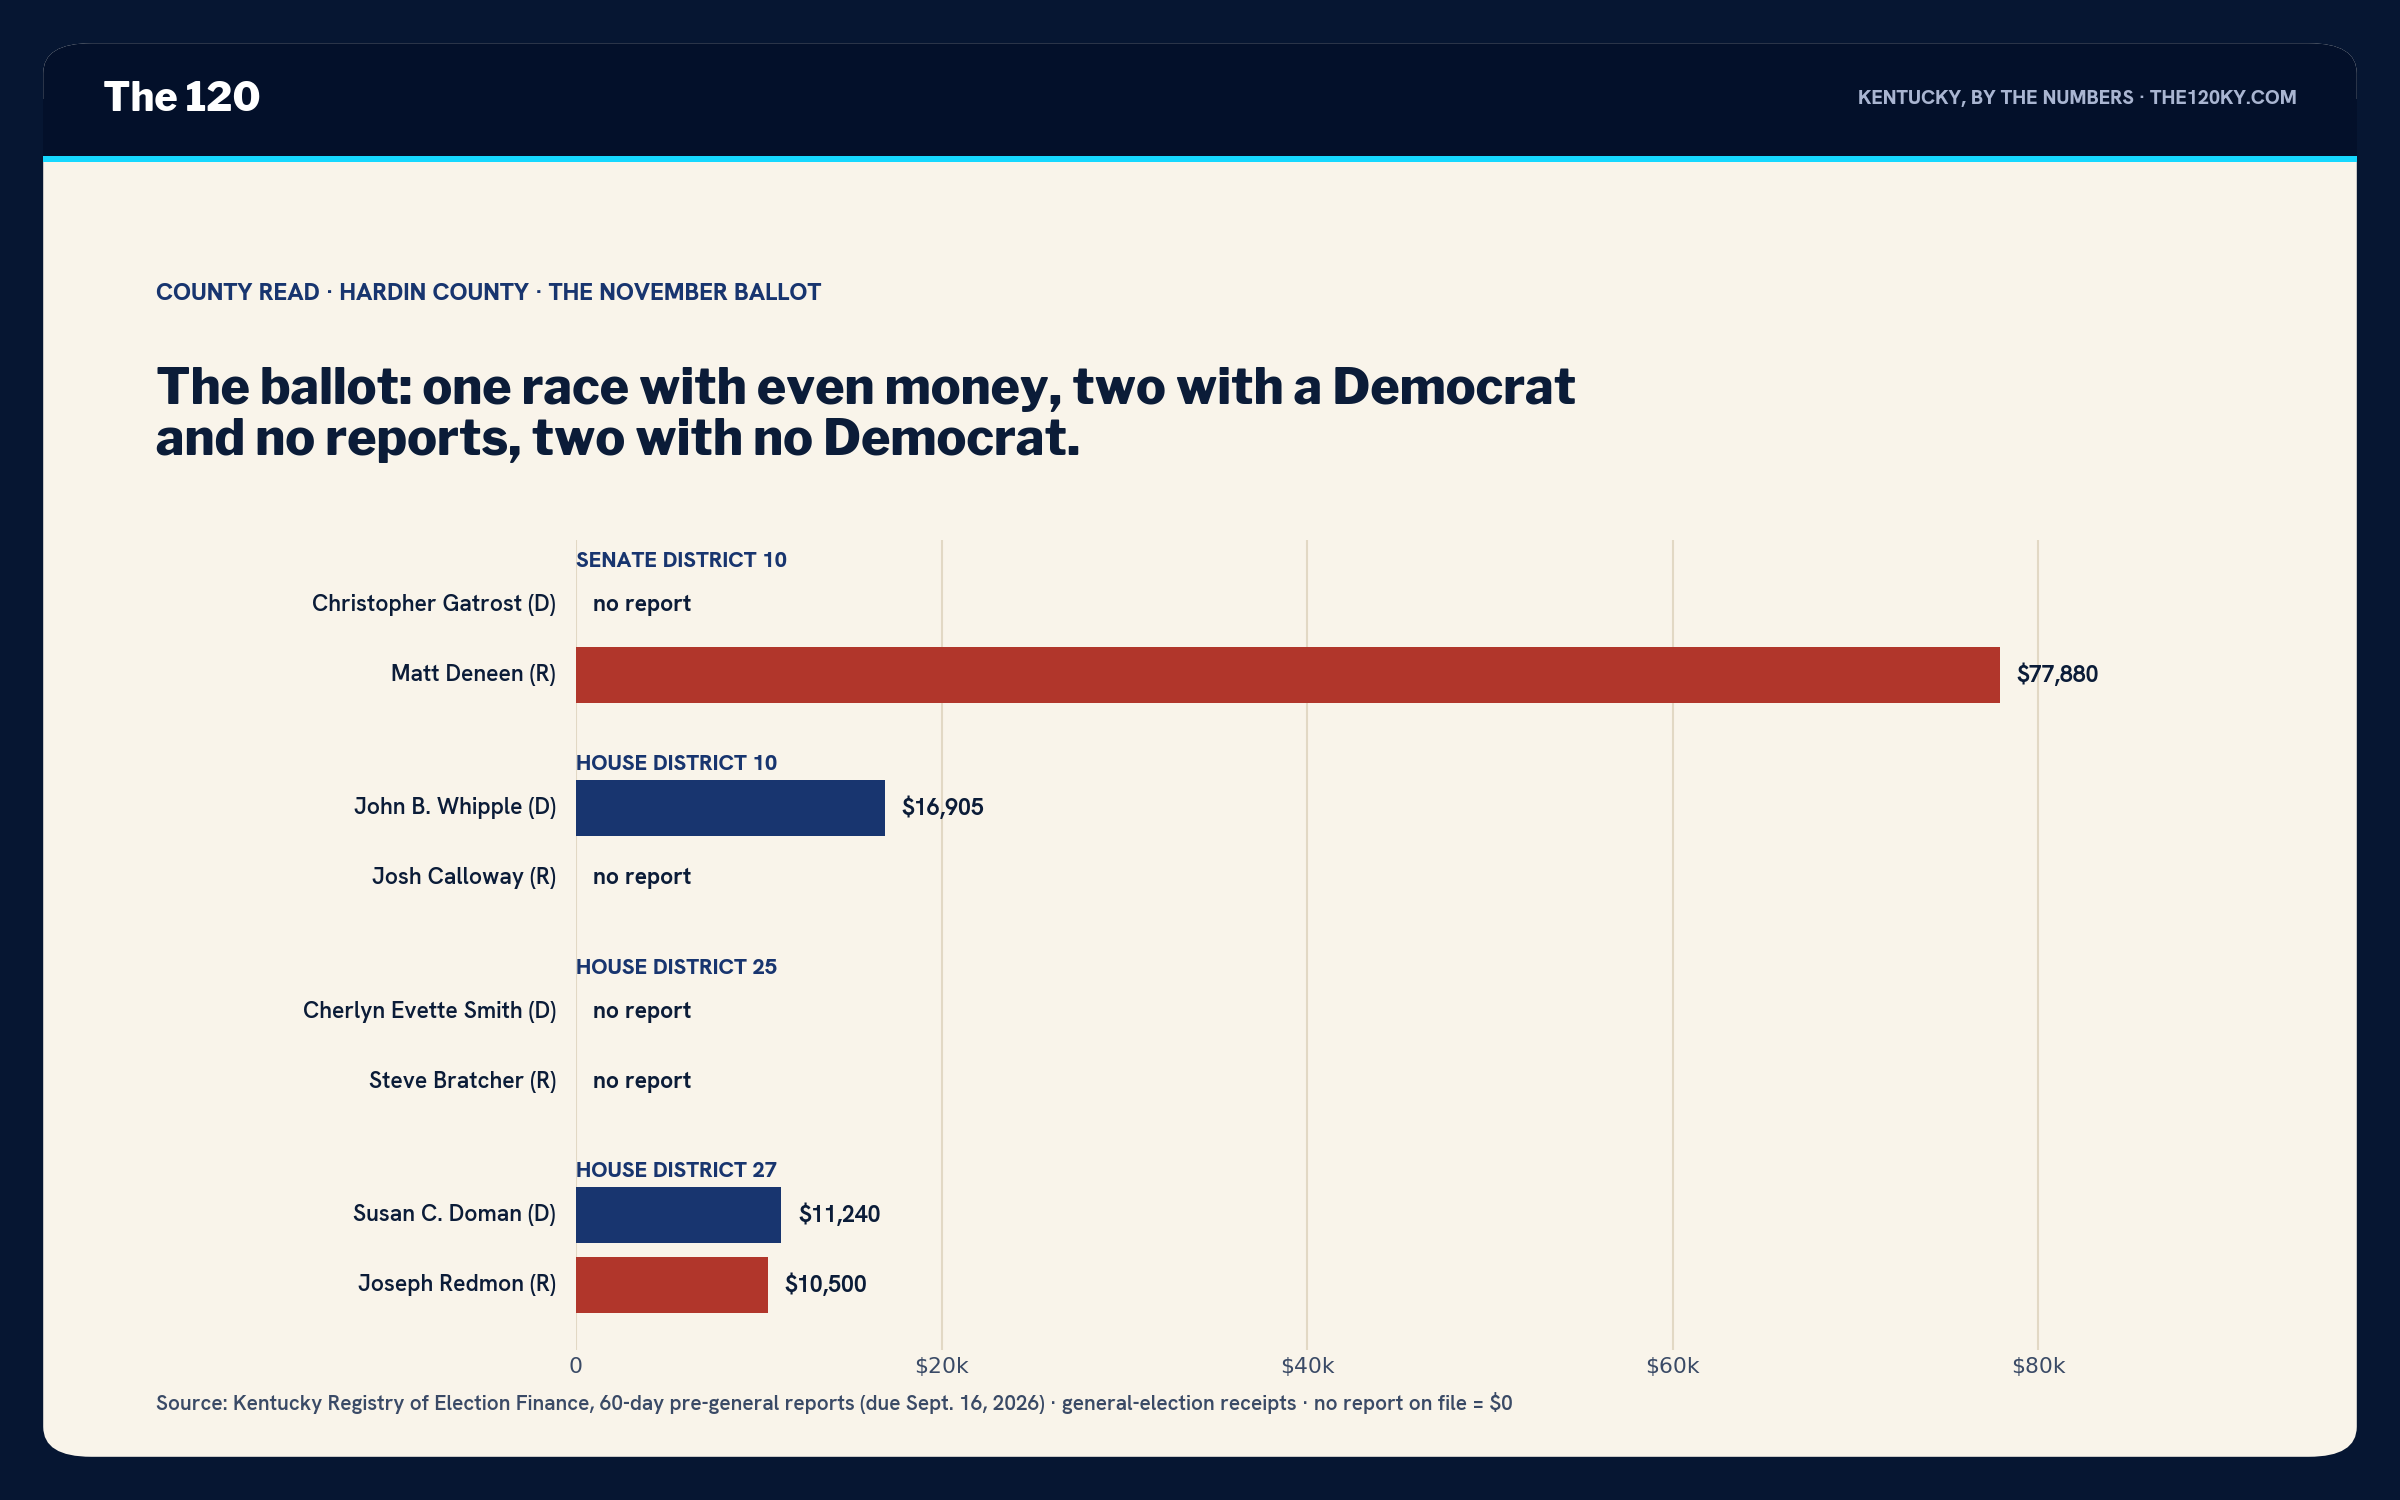
The 25th is the seat the map points at — 22 Hardin precincts, thirteen of them flips, Beshear +670 across the district's Hardin precincts, and a Democrat, Cherlyn Smith, against Steve Bratcher, who won it 65–35 in 2024. Neither of them has reported a dollar. Not one. It's one of two House seats in the state where both candidates' 60-day reports are blank, and it's sitting on the most persuadable ground in this county.
The 27th is where the money is even: Susan Doman, $11,240, against Joseph Redmon, $10,500, in a district Trump carried by 26 across all its counties — but where the Hardin precincts were Trump +342 and Beshear +731. That's a Democrat out-raising an incumbent in a seat with a persuadable Hardin core and a Republican rest-of-district, and it's the one line on this ballot where somebody's doing the work.
The 10th is Josh Calloway's, Trump +38, and John Whipple has $16,905 against a Republican with no report on file. Senate District 10 is Matt Deneen's, $77,880 against Christopher Gatrost, no report. The 18th and 26th — Samara Heavrin with $127,358, Peyton Griffee with $27,844 — have no Democrat; the 26th is the one that runs up the county's north end.
The read. Hardin is Warren with a ballot. Same paper-Democratic-turned-Republican registration, same 29-point swing, same Beshear-but-nobody-else pattern — but here the Democratic column actually turns out, the flip precincts are 45% of the county, and there are Democrats on four of six lines. The thing that's missing is money: the seat that sits on the flip precincts has none on either side, and the seat where the money is even is $11,000 to $10,500. And the thing that's missing underneath that is the third column. A county where the governor's race is decided by 175 votes and 10,000 no-party voters stayed home is a county waiting for someone to knock on those doors. This year, on this money, nobody will.
What I'm watching in November: the 25th and 27th on the precinct returns, and the no-party turnout rate. It was 19.1% in 2022. Anything over 25 in Hardin is a different county.
Tomorrow: Daviess.
Disclosure: I work in Kentucky Democratic politics and consult campaigns in this state. I have no client relationship with any candidate named above. I read this county the same way whether or not it's good news for my side — that's the job.